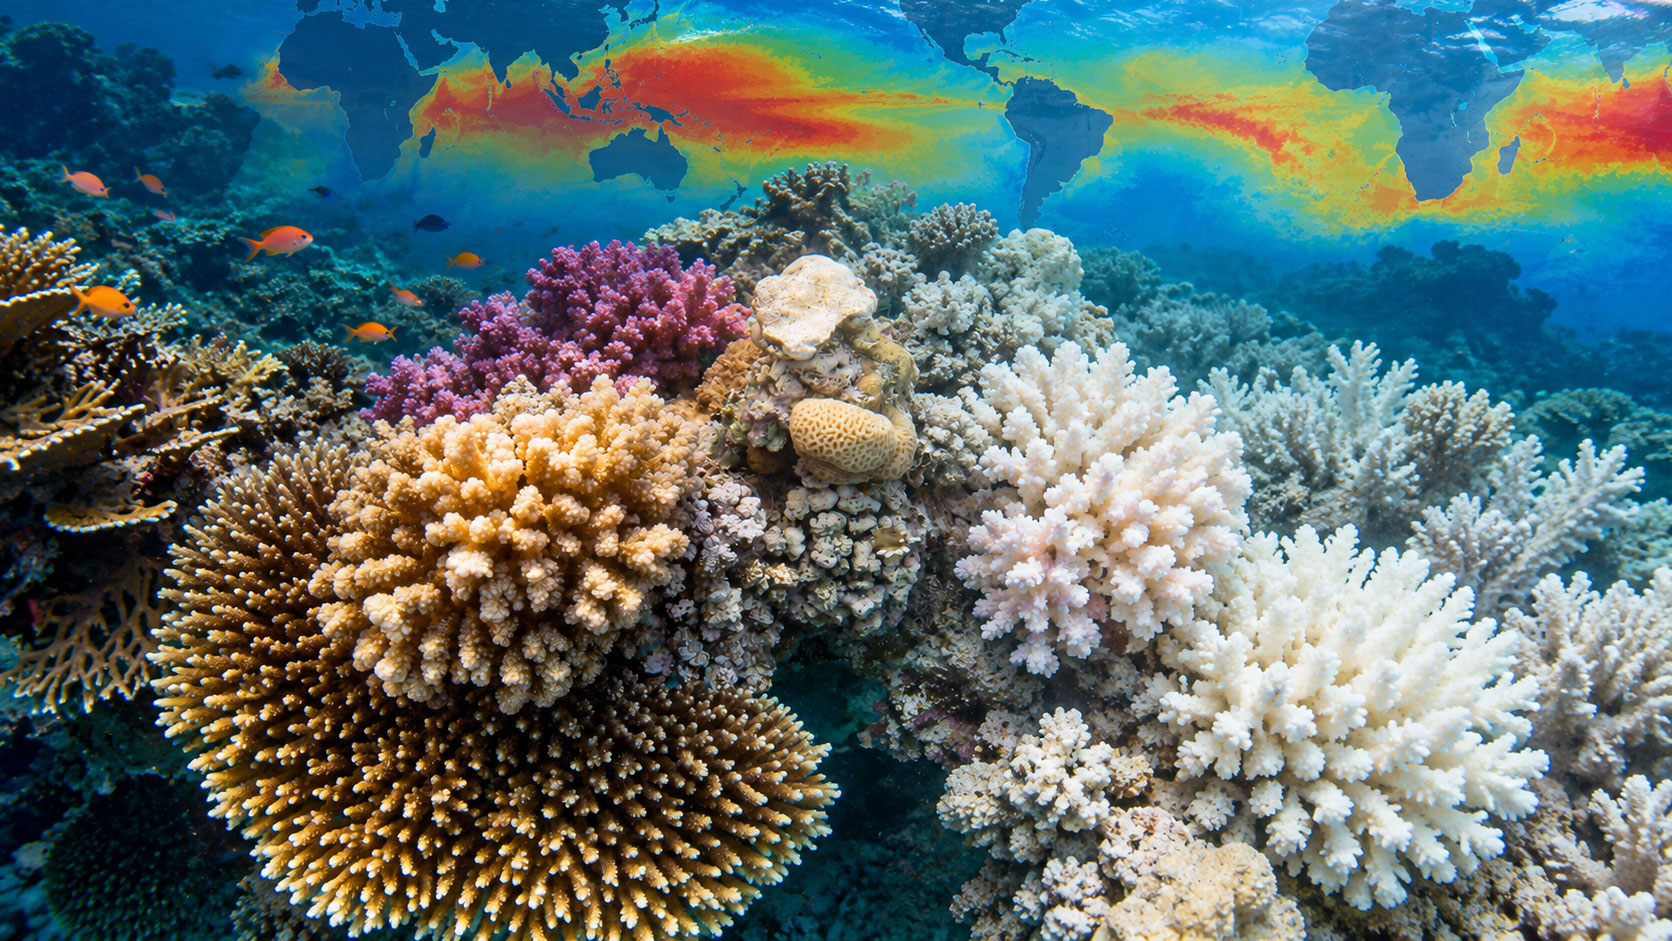
How are the coral reefs of our planet doing? Where are ocean temperatures rising, and which areas are most exposed to the risk of bleaching? Thanks to Coral Reef Watch, the NOAA monitoring system, we can follow these phenomena through satellite maps that are updated daily and freely accessible to everyone.

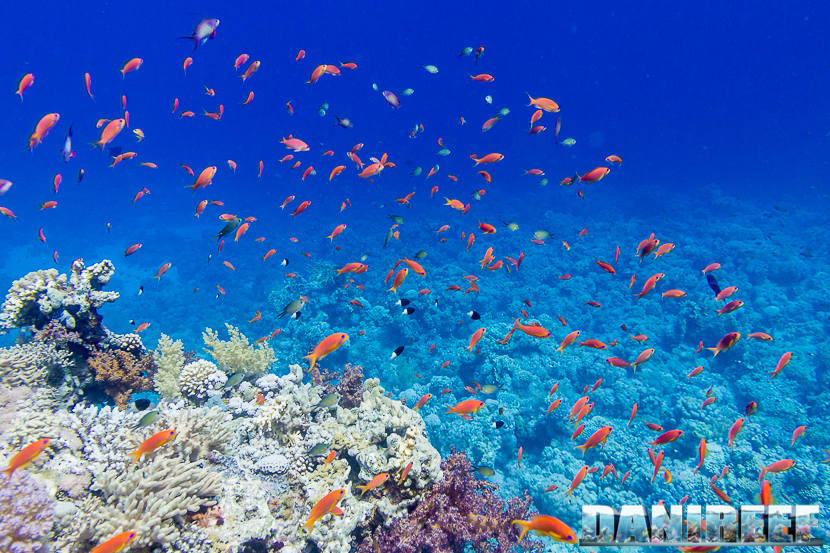
Anyone who follows DaniReef, or simply keeps a marine aquarium, knows very well how important temperature is for coral health. In our reef tanks we try to keep it as stable as possible, but in the oceans this balance is subject to rather more complex pressures.
To understand what is happening to coral reefs, NOAA (National Oceanic and Atmospheric Administration) developed Coral Reef Watch, a programme launched in 2000 that uses satellite observations, models and scientific data to monitor thermal stress in the oceans.
This is not a brand-new piece of technology, but a scientific tool that is well worth getting to know and that aquarium hobbyists can also consult freely.
A world map to observe heat stress
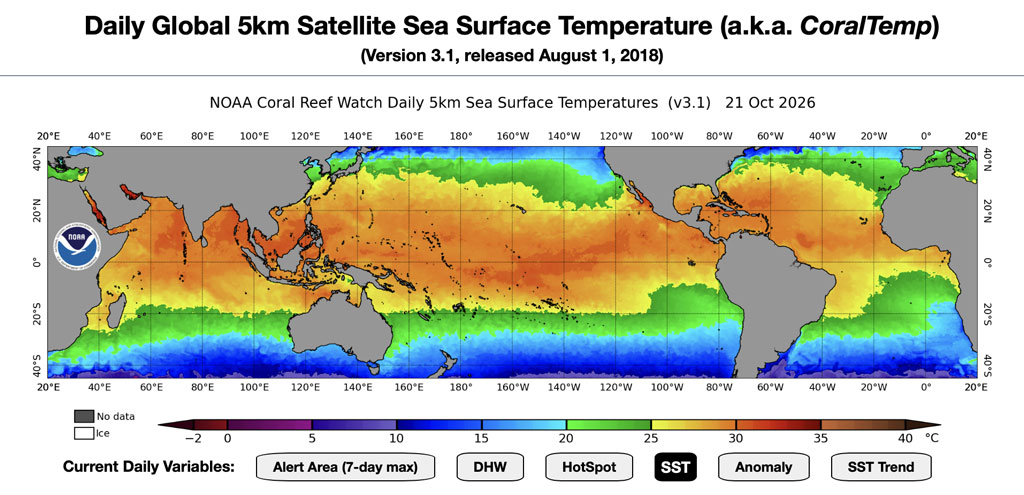
One of the most interesting features of Coral Reef Watch is the ability to view the thermal conditions of the oceans through a range of global maps. The system provides satellite products with a spatial resolution of about 5 kilometres, updated daily, which make it possible to analyse different parameters.
We can look at sea surface temperature (Sea Surface Temperature, or SST), the anomalies compared with reference climatological values, and even how quickly the temperature is changing over the course of a week.
But perhaps the most interesting indicator for coral lovers is Degree Heating Weeks (DHW).
This parameter measures the heat stress accumulated over the last 12 weeks, making it possible to assess not only how warm the water is, but also how long corals have been exposed to potentially harmful temperatures.
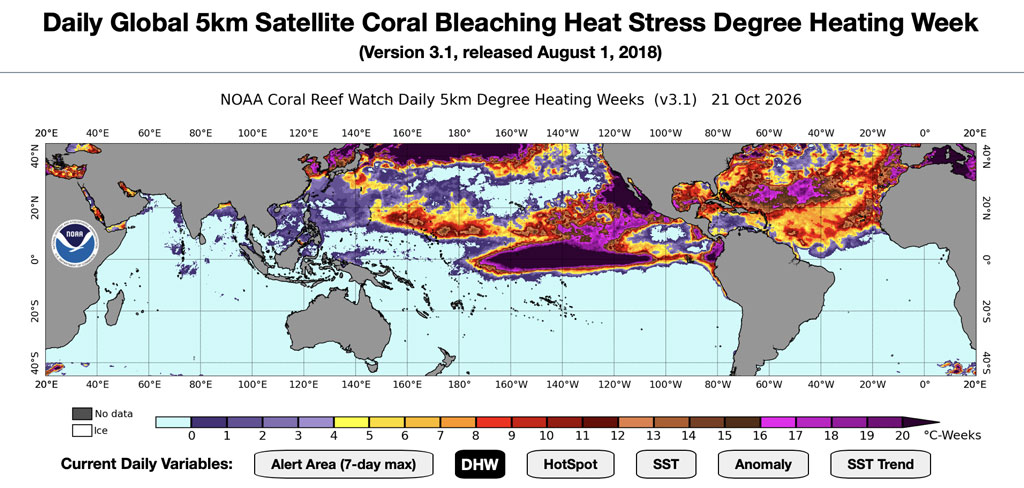
In fact, it is the combination of intensity and duration of heat stress that is one of the main risk factors for bleaching.
The bleaching alert maps
Among the various tools available, we especially recommend exploring the NOAA Bleaching Alert Area map. This view shows the maximum heat-stress alert level reached in the different ocean areas over the last seven days.
The alert levels were expanded in December 2023 and now go up to Bleaching Alert Level 5, so that even the most extreme heat-stress conditions can be represented.
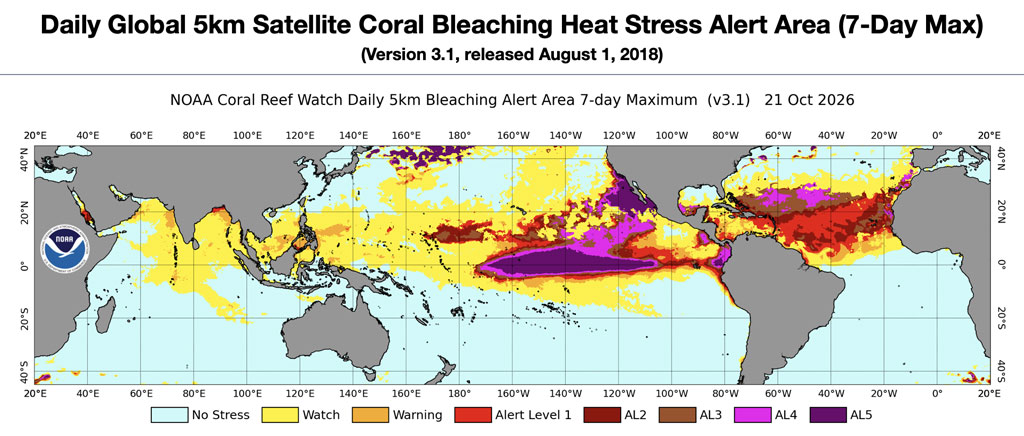
One point is worth stressing: these maps do not directly show how many corals have already bleached or died; rather, they identify environmental conditions associated with increasing risk. Confirming the real effects on coral reefs requires direct observation and field monitoring.
Why do corals turn white?
When exposed to unfavourable environmental conditions, above all excessively high temperatures, corals can lose the symbiotic algae living in their tissues, known as zooxanthellae, or their pigments.
This is the phenomenon known as coral bleaching.
A bleached coral is not necessarily dead: if environmental conditions improve it can recover, although this is still very difficult. When the stress is too intense or prolonged, however, mortality is practically certain.
NOAA also explains this process on a dedicated educational page about coral bleaching.
On DaniReef we have covered this topic several times, for example reporting on the dramatic loss of coral cover recorded on Australia’s Great Barrier Reef in 2024-2025 (article in Italian). We have also looked at how reducing light intensity can help mitigate heat stress in some coral species (article in Italian).
A tool worth exploring
The most fascinating part of Coral Reef Watch is that we can look directly at the data used by scientists. Through the NOAA 5 km satellite products page we can switch from one map to another, select different regions of the planet and also browse animations and historical data.
Our advice is to spend a few minutes exploring these maps: they are a fascinating way to better understand the oceans and a reminder of just how delicate the balances are that we try to reproduce, on an infinitely smaller scale, in our marine aquariums.
Scopri di più da DaniReef - Portale dedicato a Acquario Marino e Dolce
Abbonati per ricevere gli ultimi articoli inviati alla tua e-mail.