


Our new method DaniReef LAB for PAR measurement
During the long nights spent on our forum (here) we always wondered how could we compare PAR from different ceiling lights. Even though we had the perfect device, the Quantum Meter MQ-510 di Apogee, we always referred only to the value measured at the centre at 20 cm of distance, more or less.

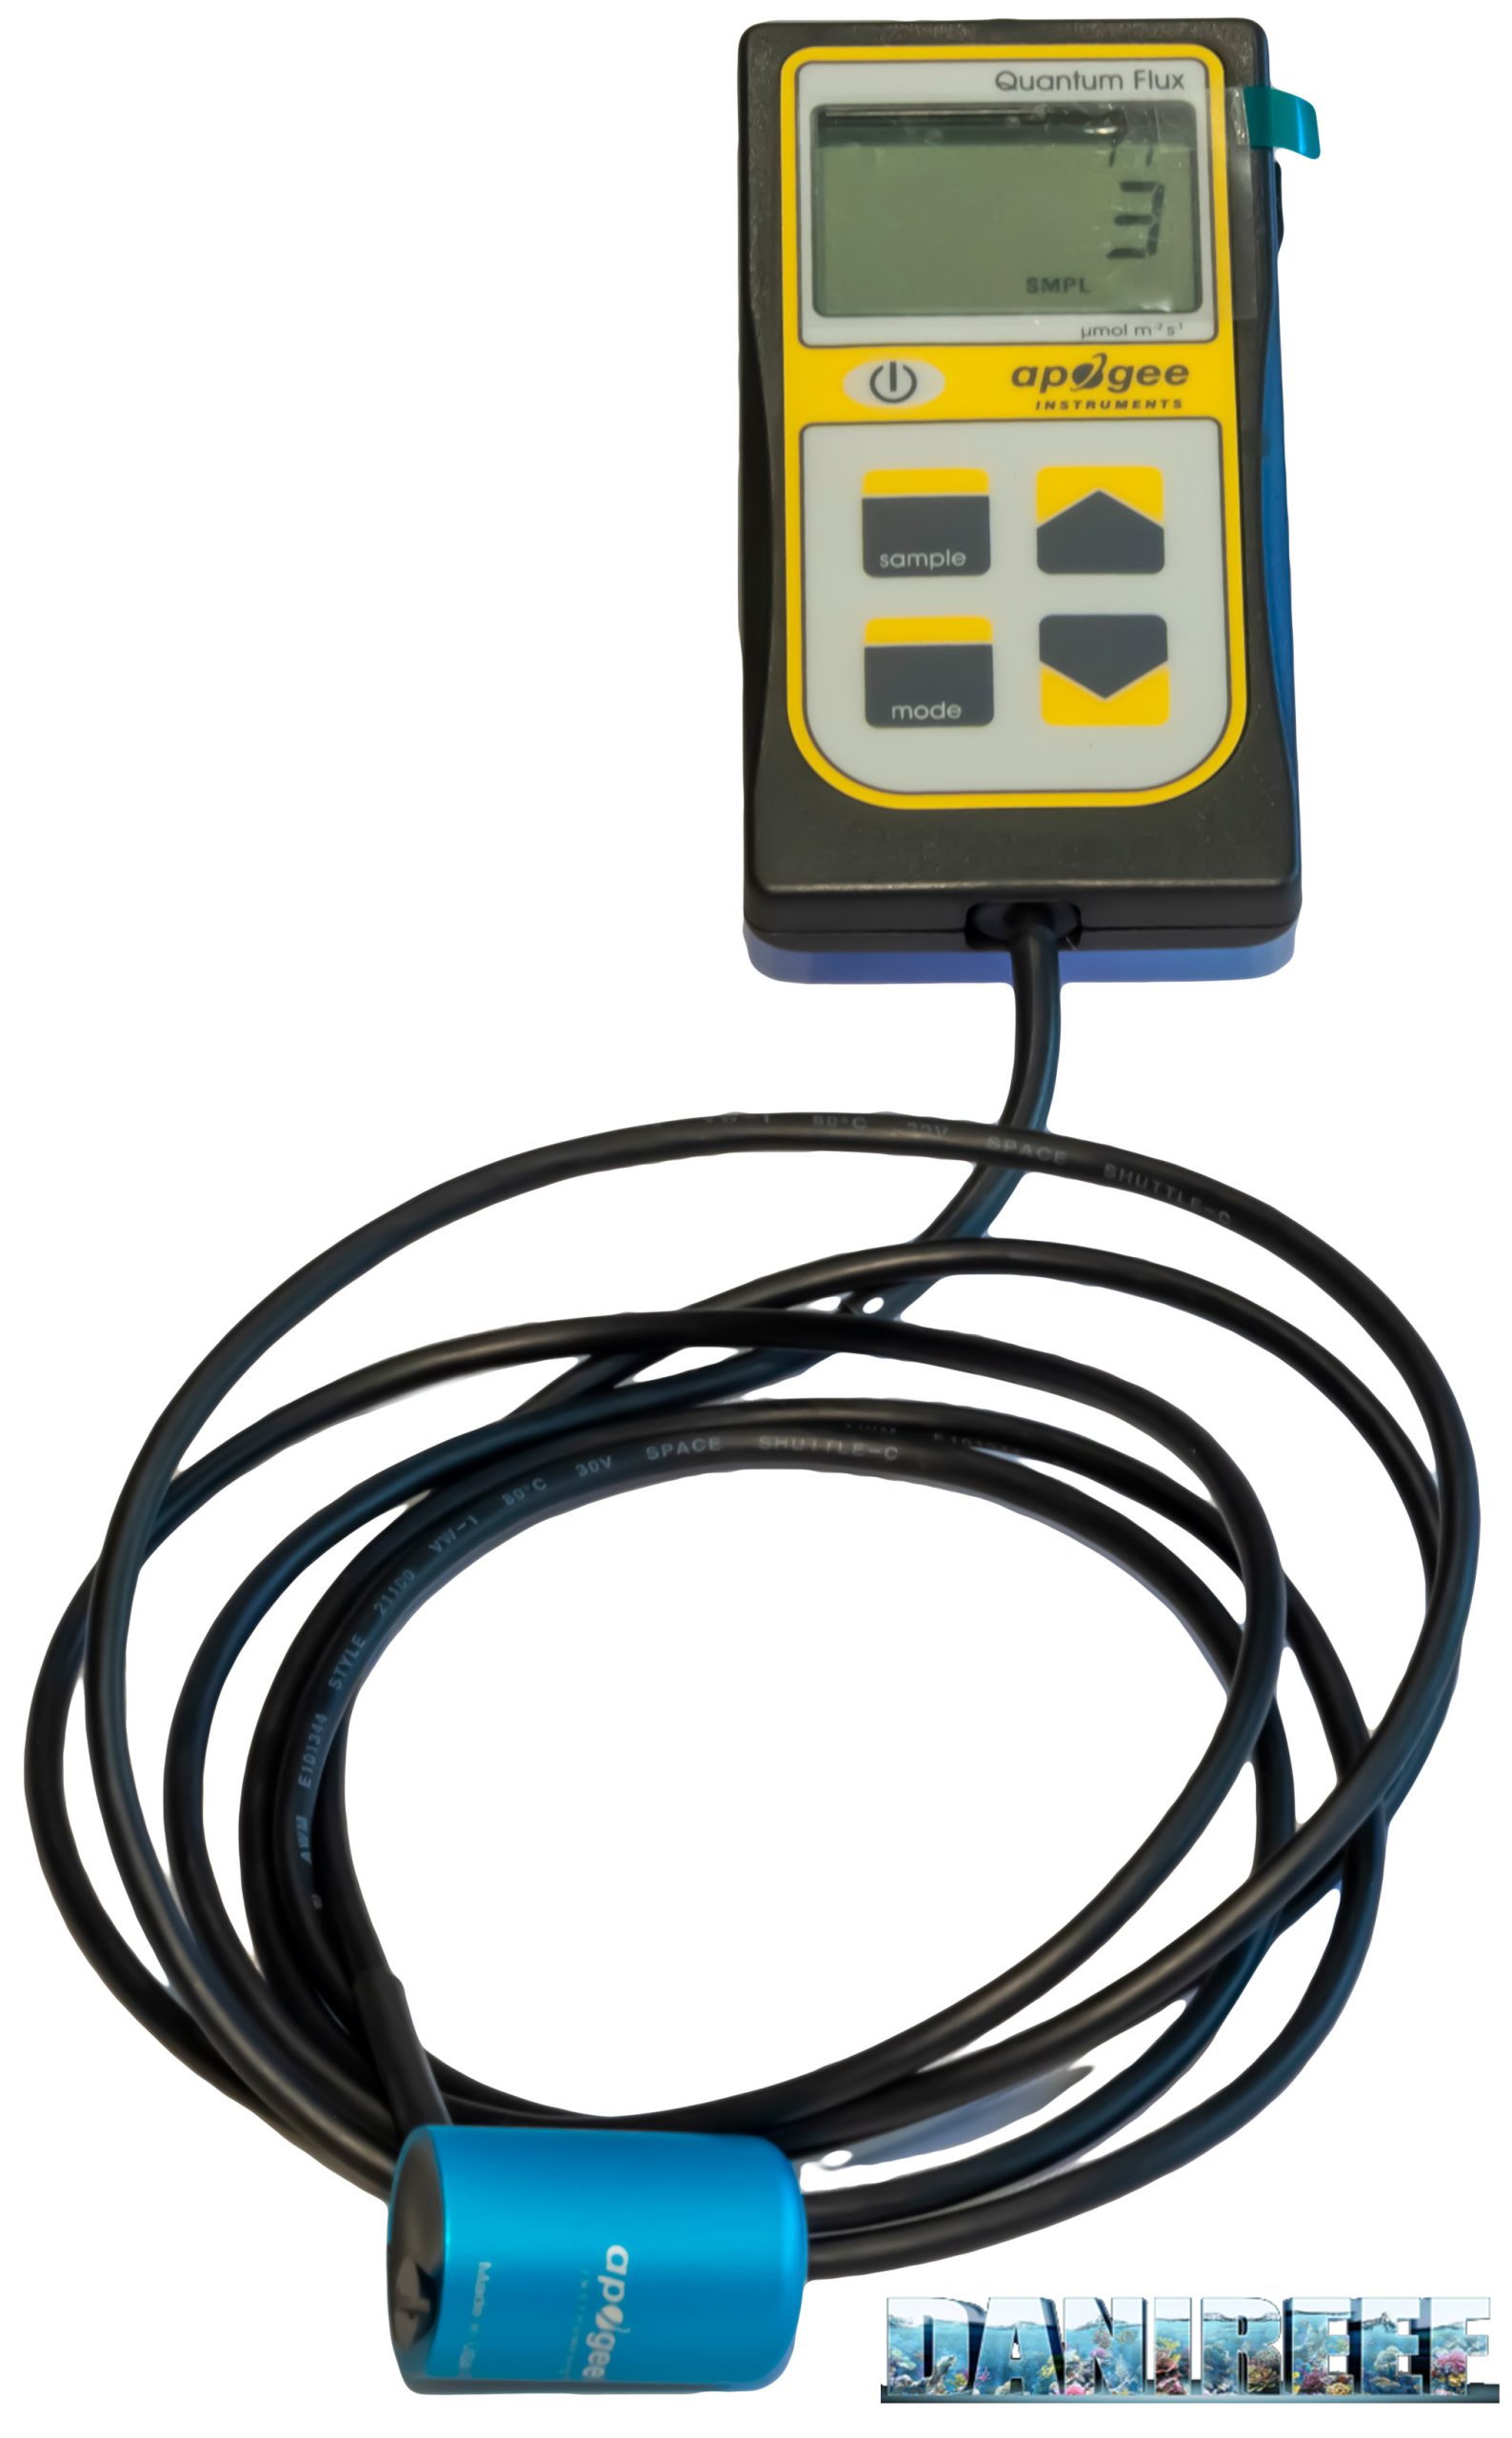
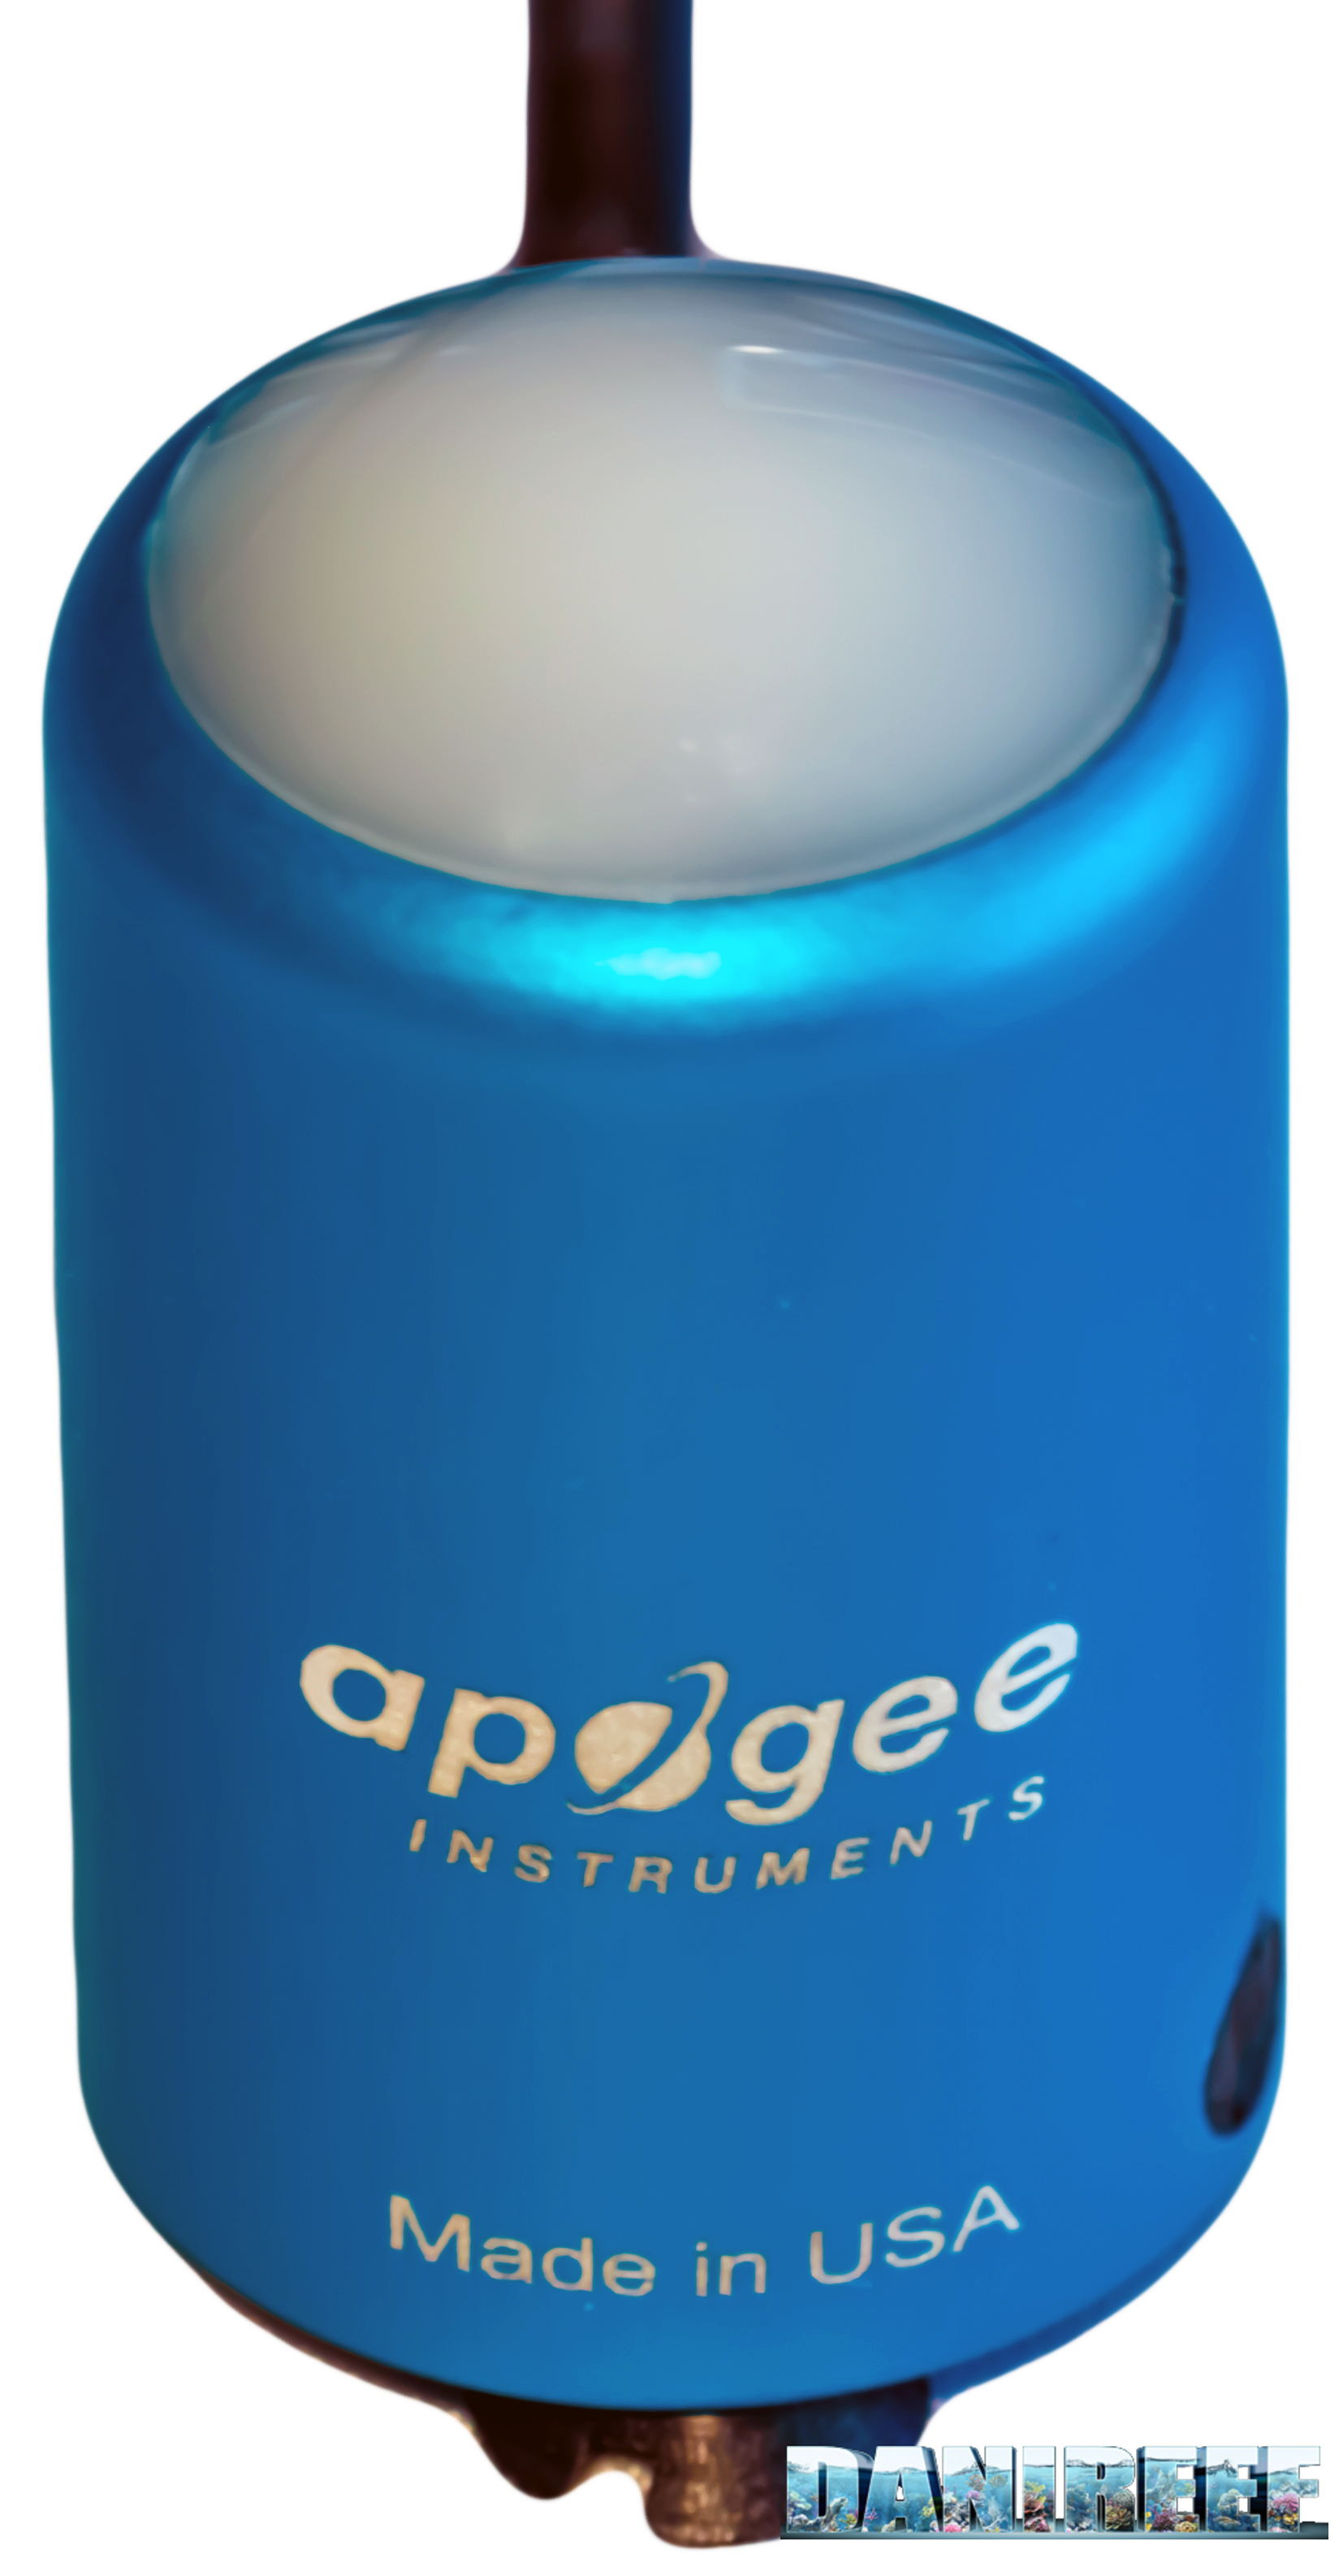
The Quantum Meter MQ-510 measures the PAR, expressed in PFFD that is photosynthetic photon flux density in μmol m-2 s-1. This device is calibrated to work underwater, so if it’s in air the measured value has to be divided by 1,32 that’s the dive factor. We have to do the conversion. The values you’re going to see are correct.
We decided to make a square base of 70×70 cm, we set 25 fiducial points where we placed the sensor Quantum Meter MQ-510 and we also made 3 lifts of 20, 40 and 60 cm for the ceiling light, in order to have the same distance from the sensor. This will allow us to create the curves which can be compared to other ceiling lights’s, all tested at the same distances. Notice that this distance is measured between the base of the sensor and the ceiling light. In reality it should be decreased of 3,5 cm that is the height of the measurement cylinder and increased by 0,5 cm that’s the dimension of the spacers that lift the ceiling light.
In total the three measurements are made from 17, 37 and 57 cm of distance. Because they’ve been done in air they will be corrected.
PAR measurement from 17 cm of distance
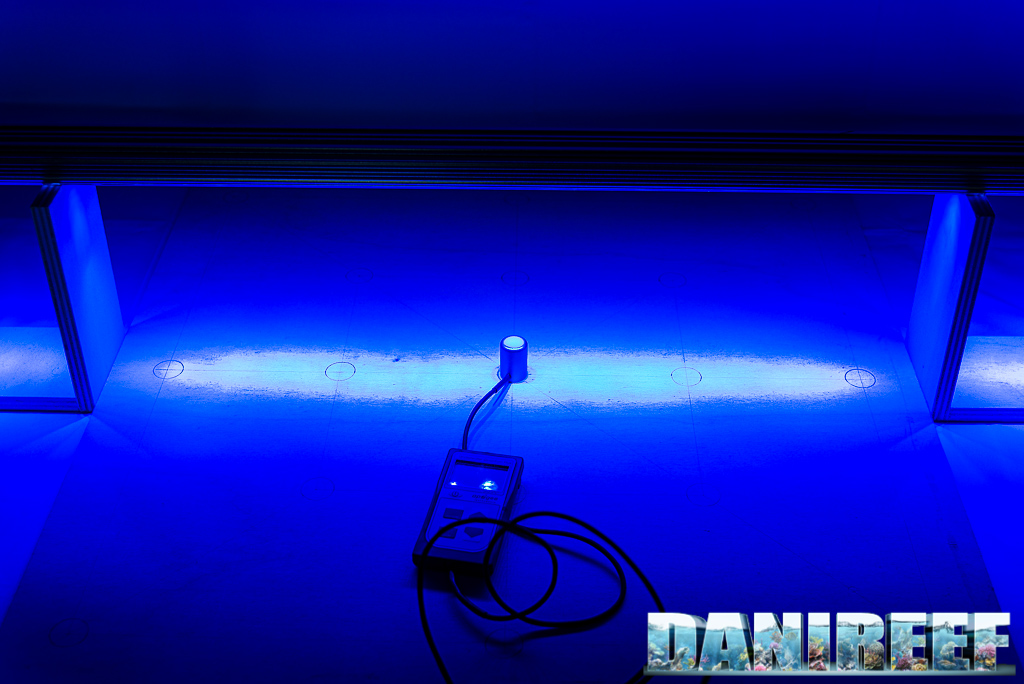
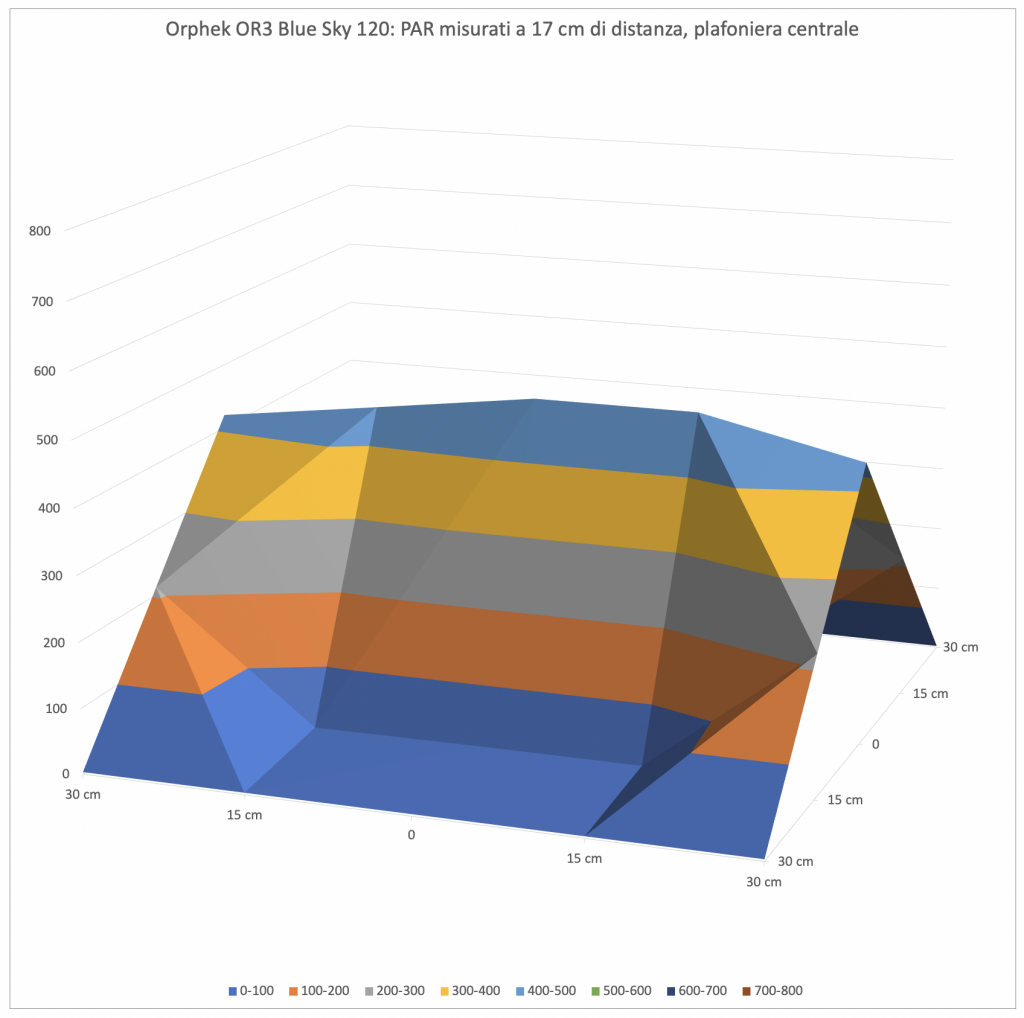
This is the condition of the test. Below there are the chart and the device, above you can glimpse the bar (in this case it was a OR3 Blue Sky) placed on the spacers.
These are the values:
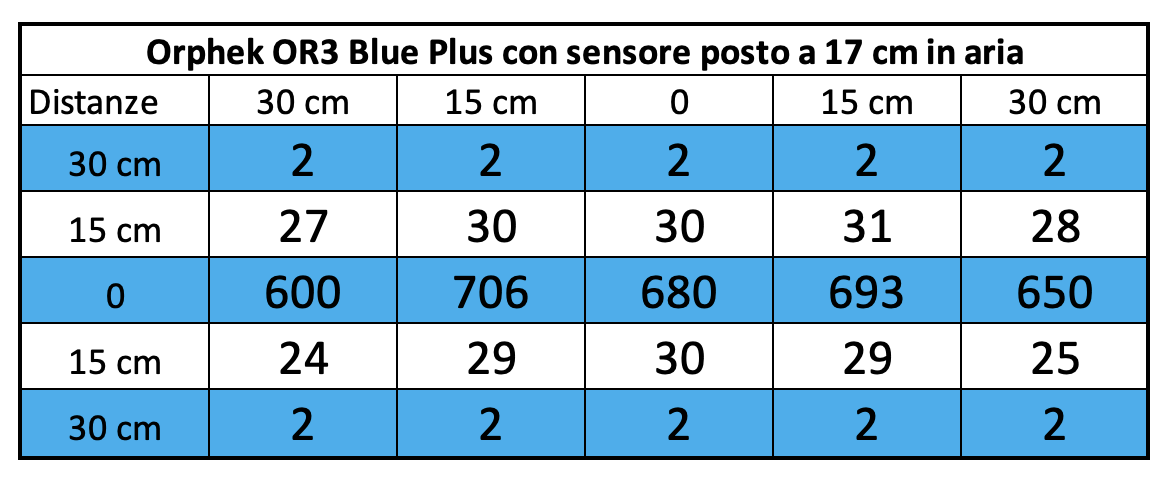
And that’s the corresponding chart, we came back to our classical scale in order to compare similar ceiling lights, but being this LED bars we lowered the maximum scale. For the future bars you will find the same evaluation scale.
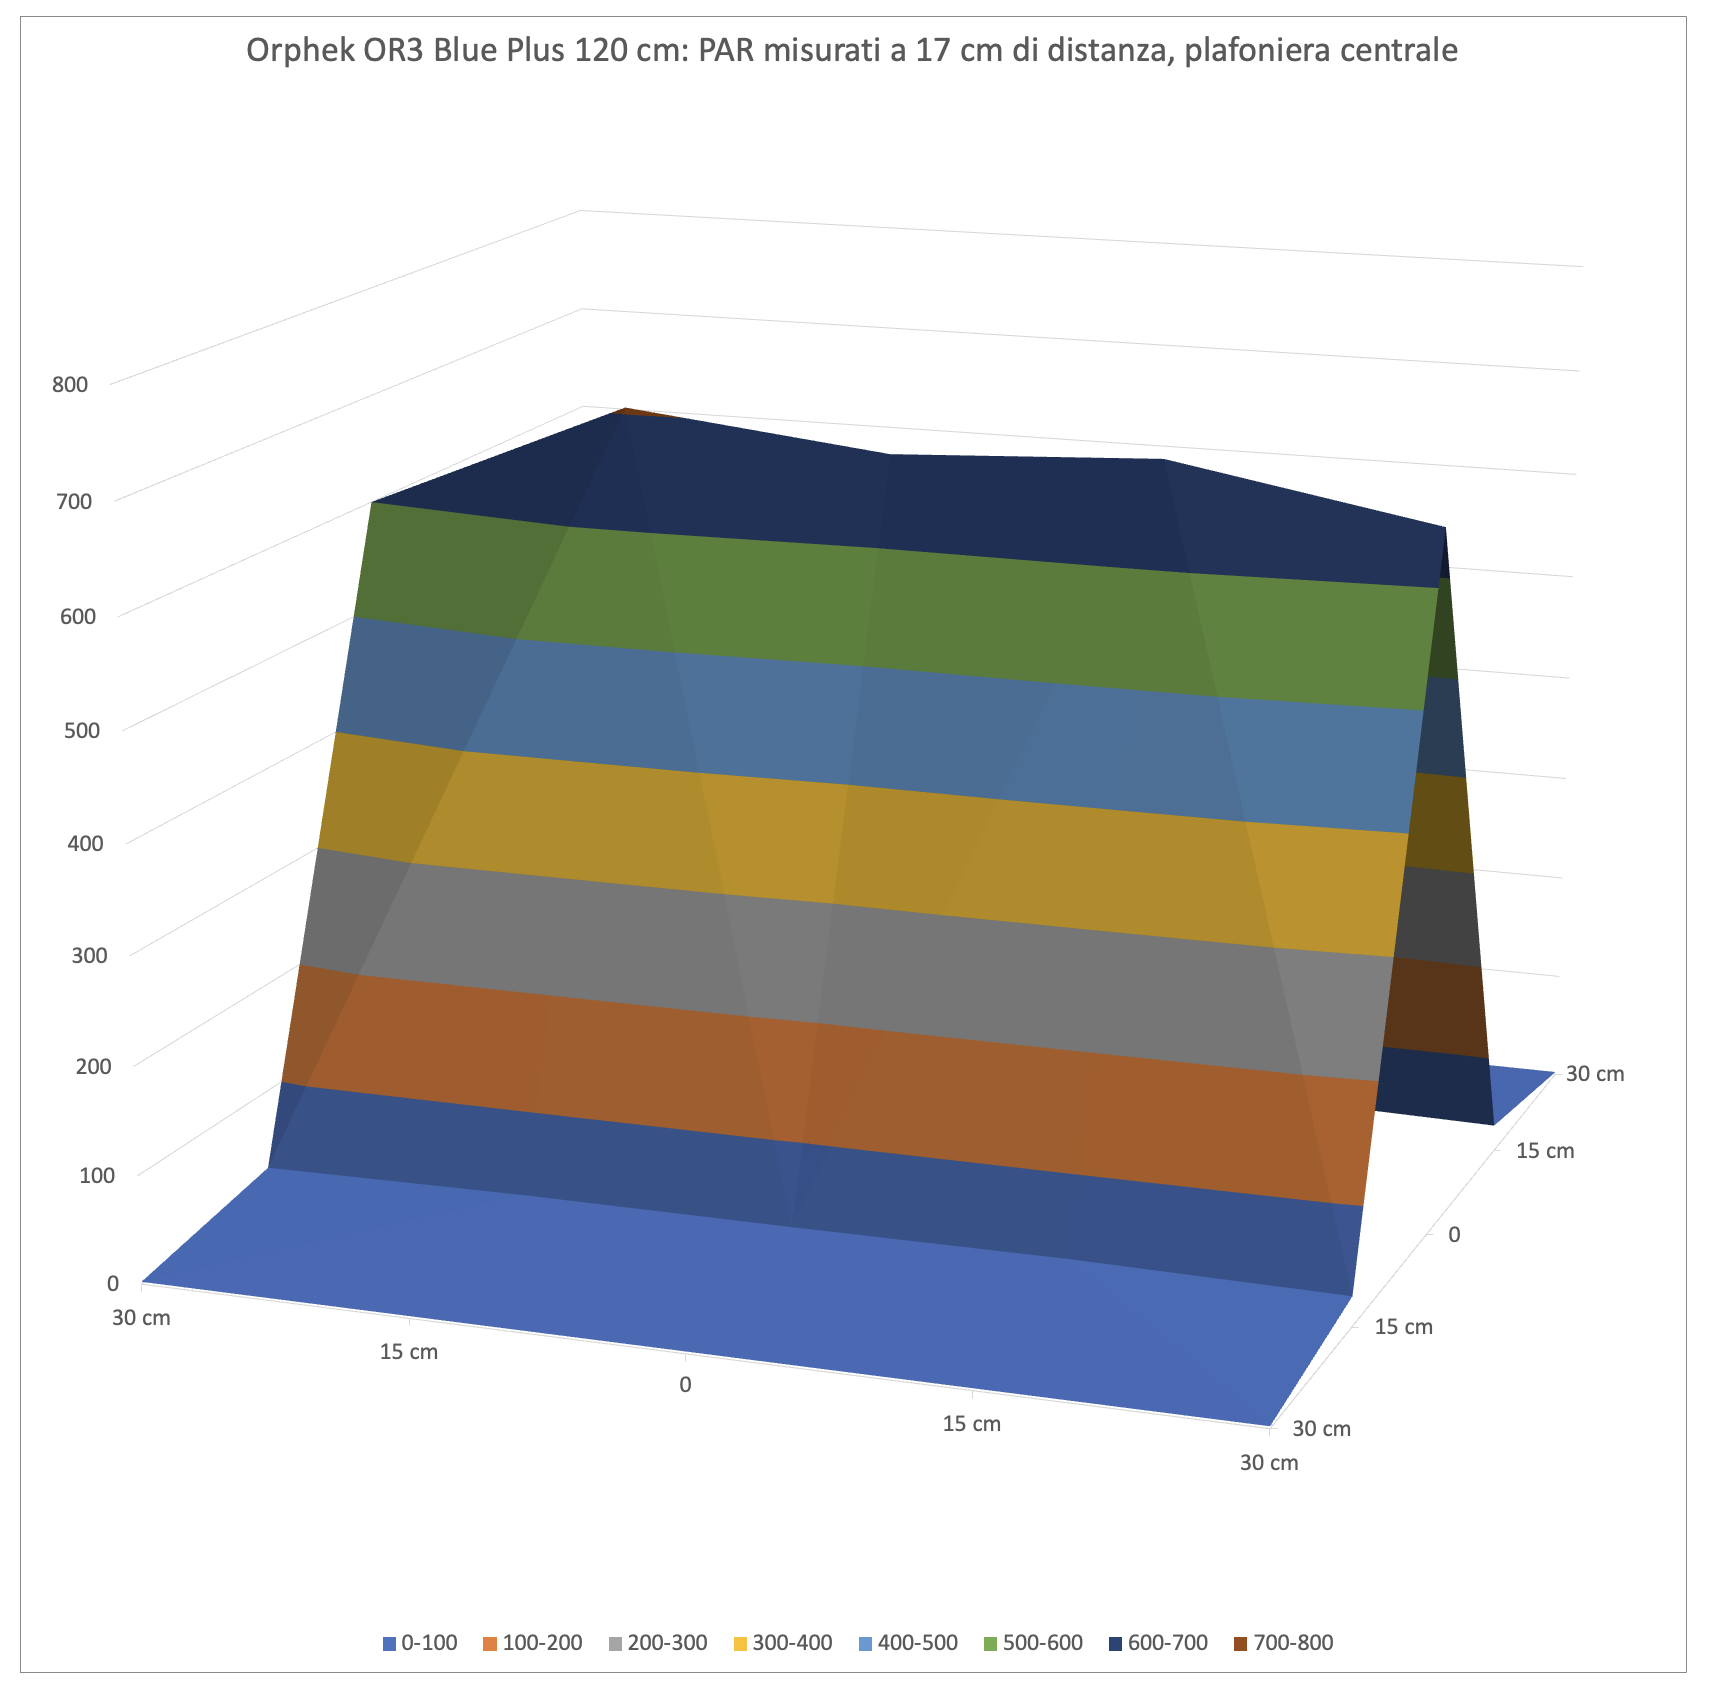
As you can see the bar creates a curve that resembles a tent, with the space differences due to the kind of used LED. Unlike the classic ceiling lights the decay is very linear, at 20 cm from the light source.
Let’s see the differences between the charts of the LED bars we’ve been tested until today and, of course, the old OR2 Blue Plus. Remember that the evaluation scale is the same.
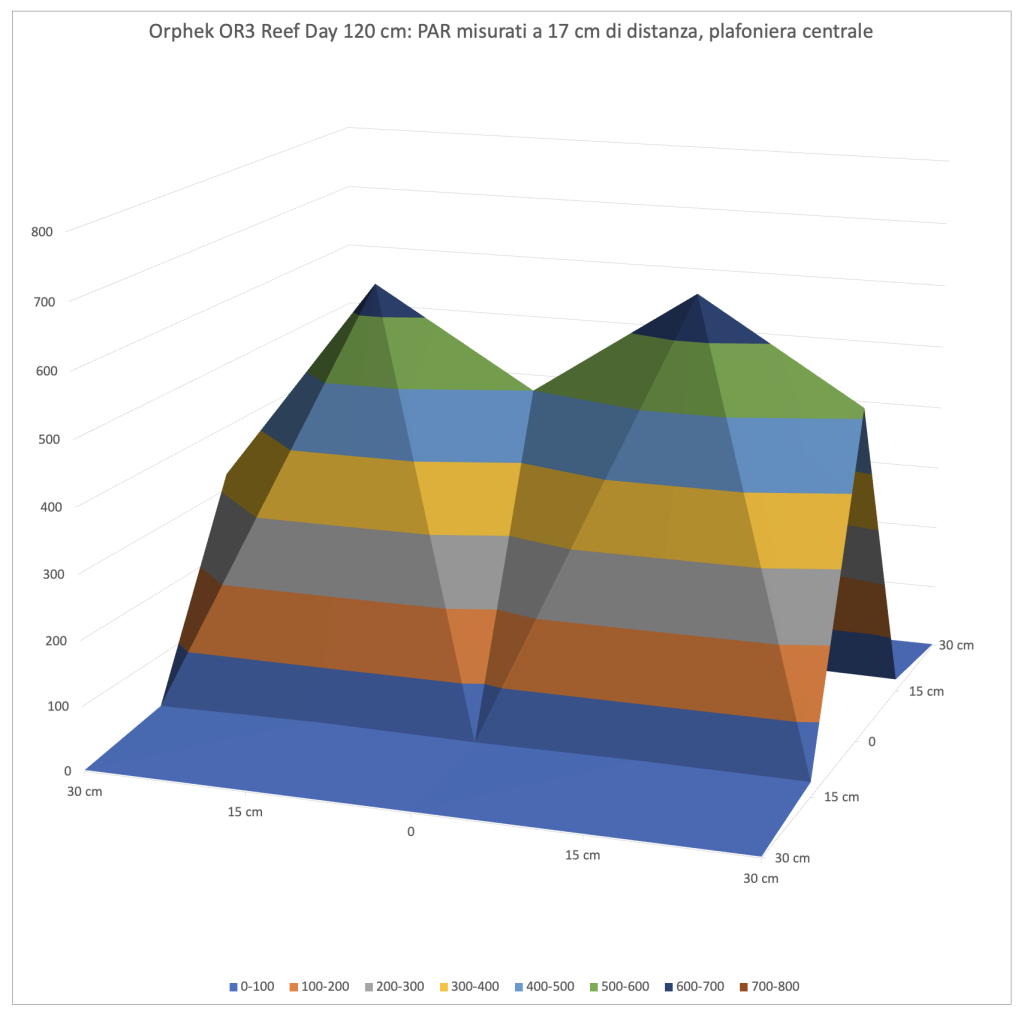
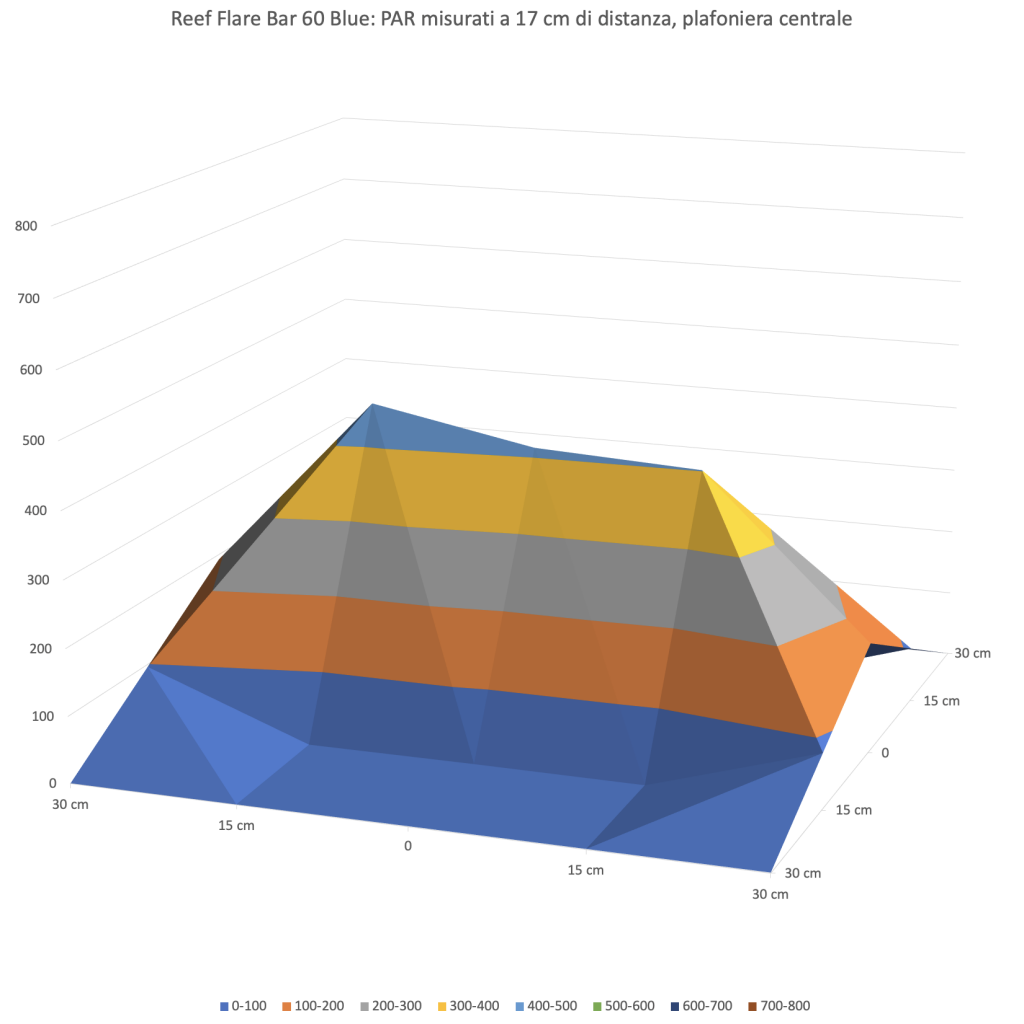

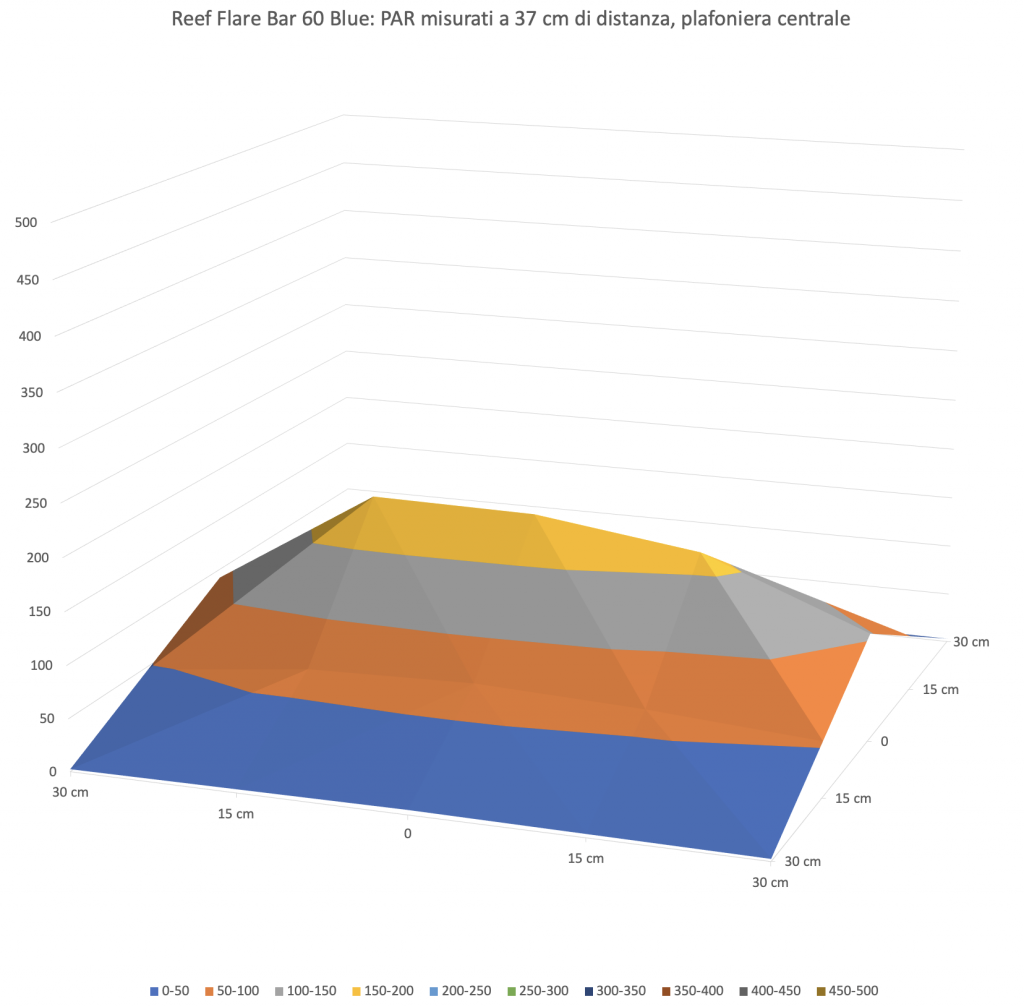
As we expected at this wavelength, the PAR value is the higher of all other ceiling lights at wide spectrum. The difference bewteen the old OR2 is incredible, and remarkable between the Reef Flare S of Reef Factory, which although is only 60 cm long so the decrease of PAR on the sides is normal.
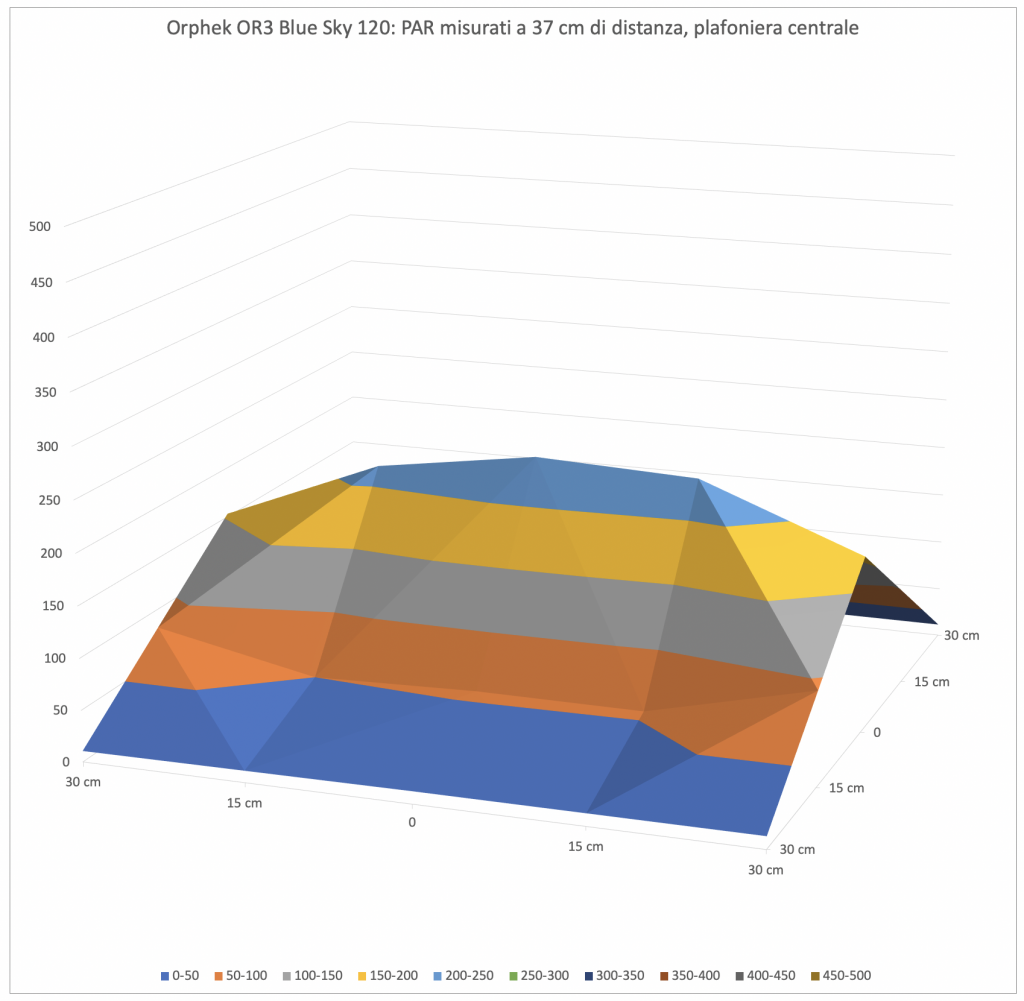
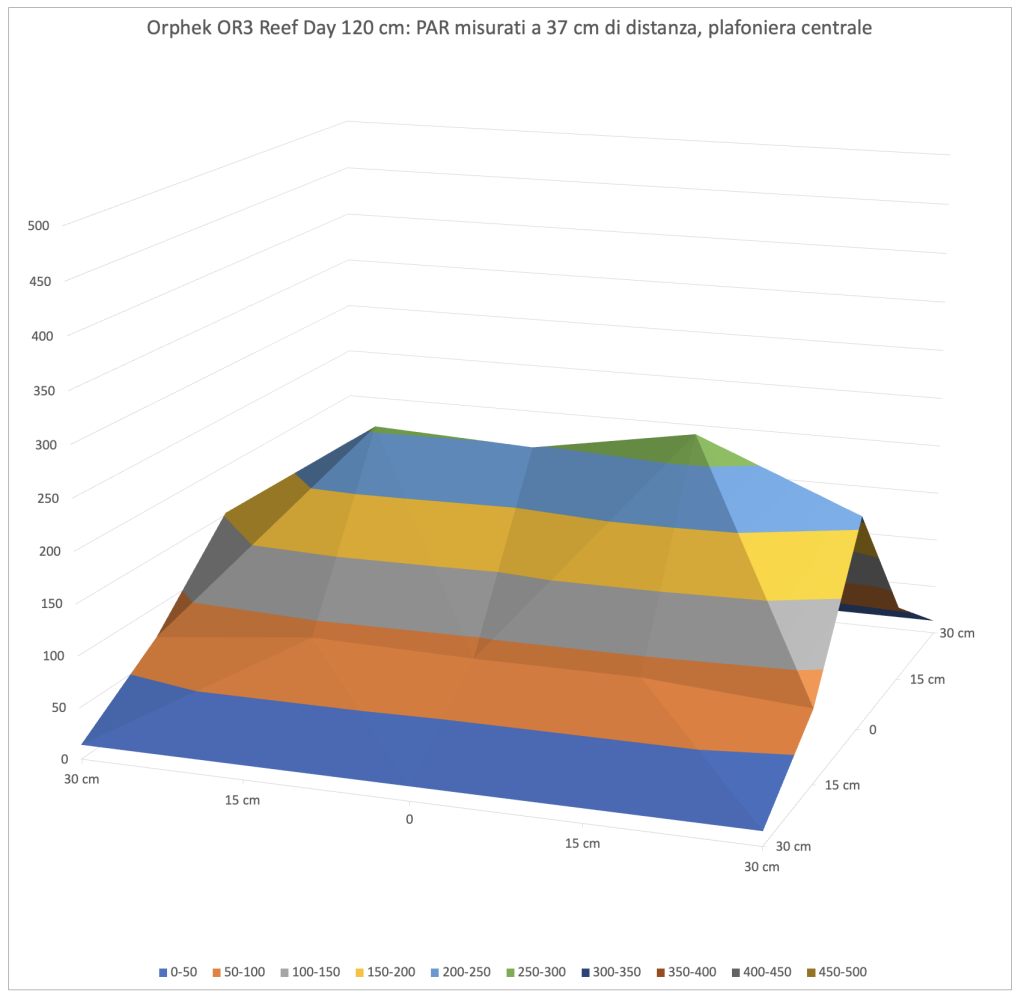
PAR measurement from 37 cm of distance
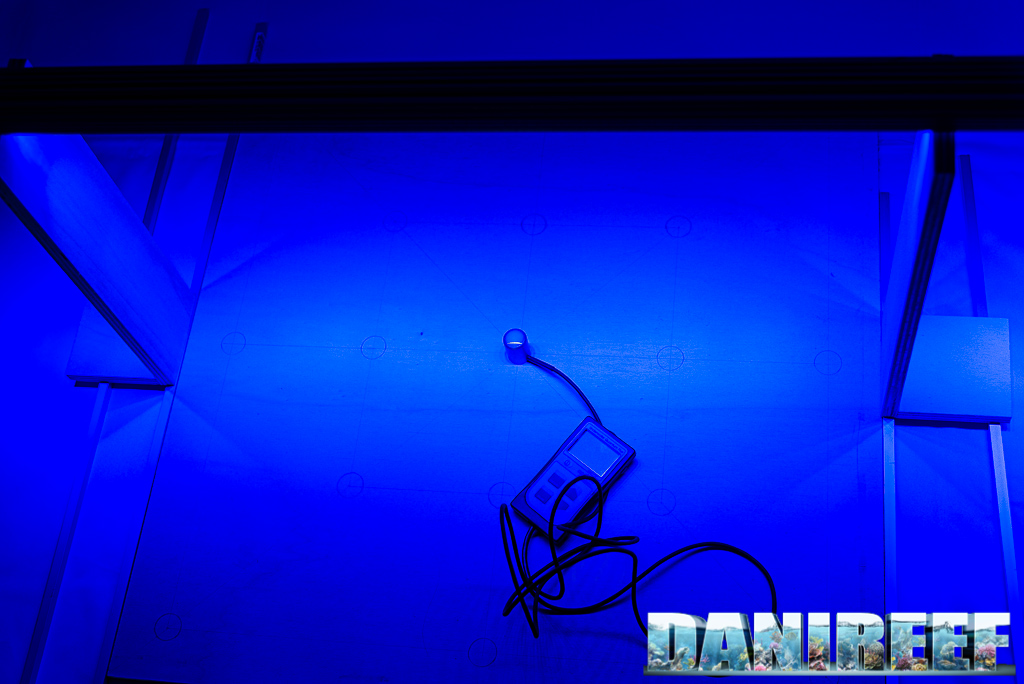
This is the condition of the test. Below there are the chart and the device, above the bar (in this case it was a OR3 Blue Sky) placed on the spacers.
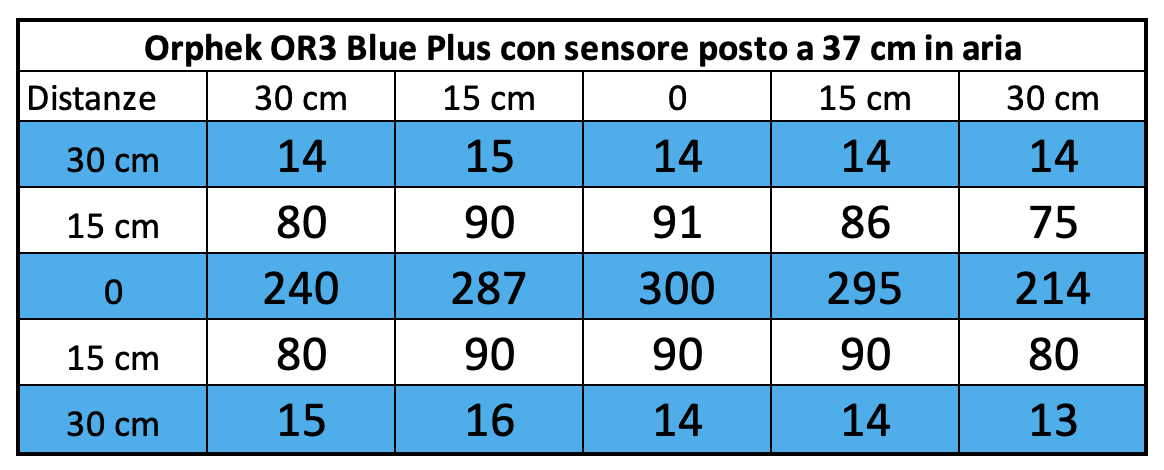
Here the collected values:
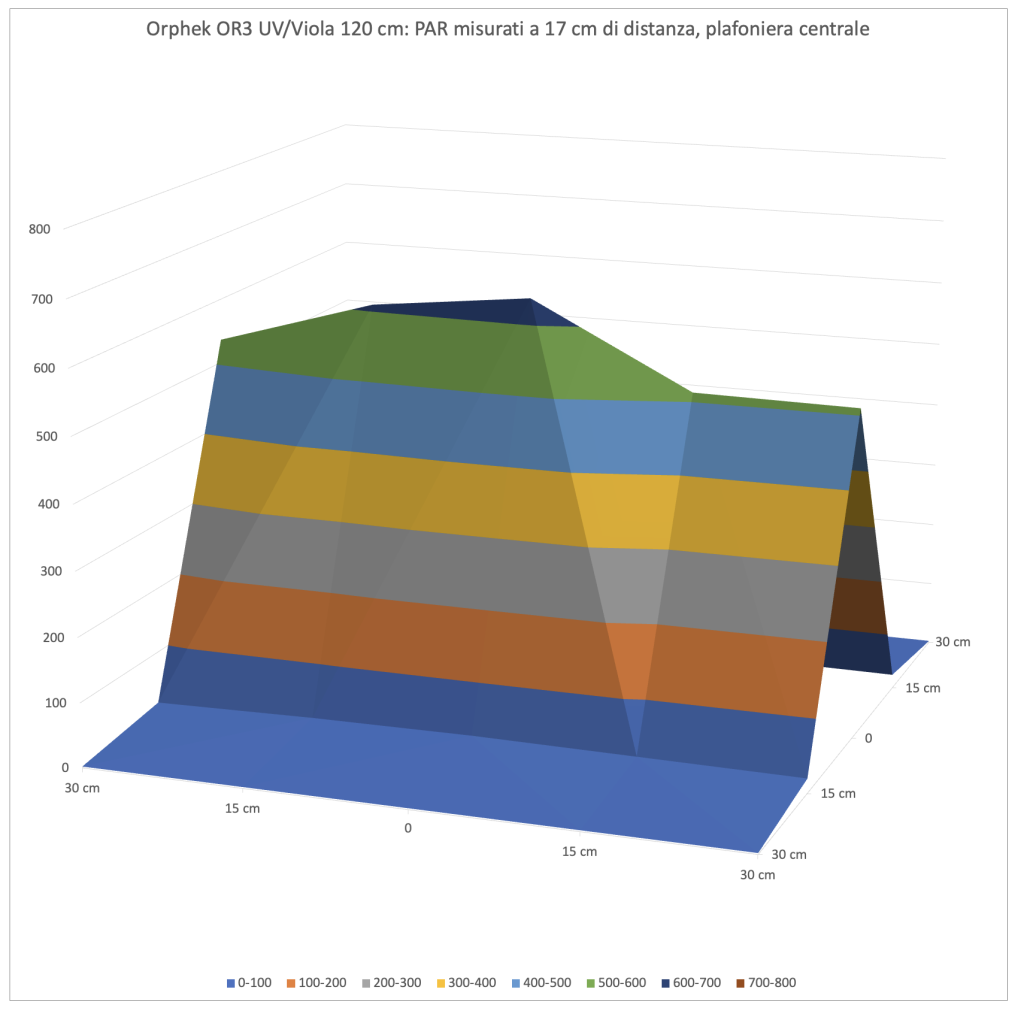
And that’s the corresponding chart. In order to maintain uniformity we use the same scale for ceiling lights of the same class, that means they’re similar for power and type.
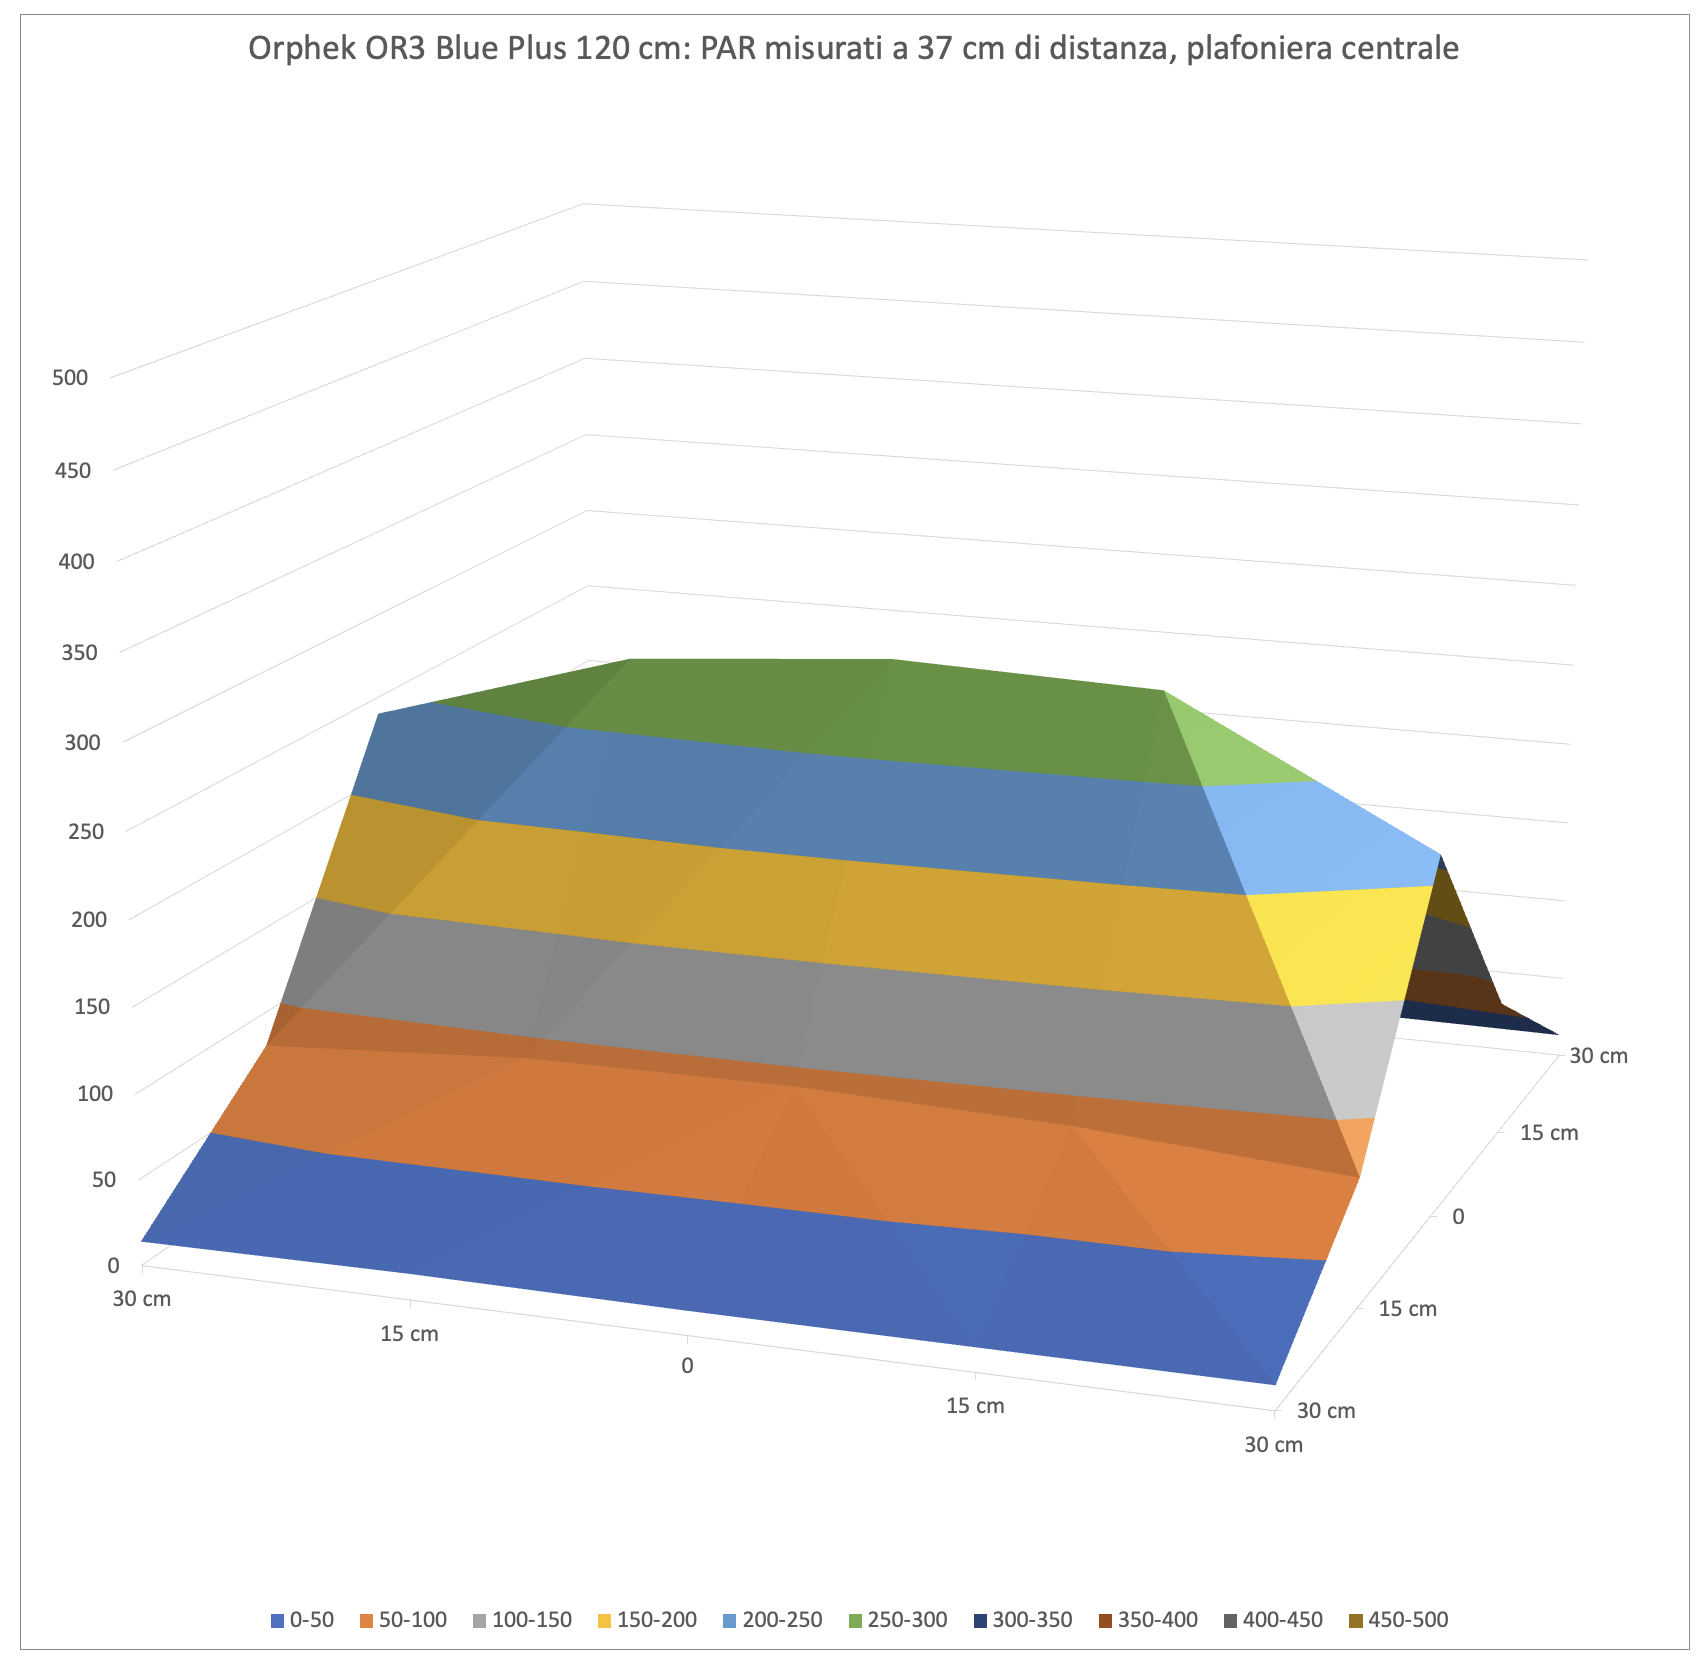
With a bigger space between ceiling lights and sensor, it decreases the difference between PAR in the middle and on the sides. The light spreads wide, but the value in the middle decreases from 680 to 300 μmol m-2 s-1, taken in the brigher points.
Stands out that the covering is more complete and linear. It still remains this small offset on the right.
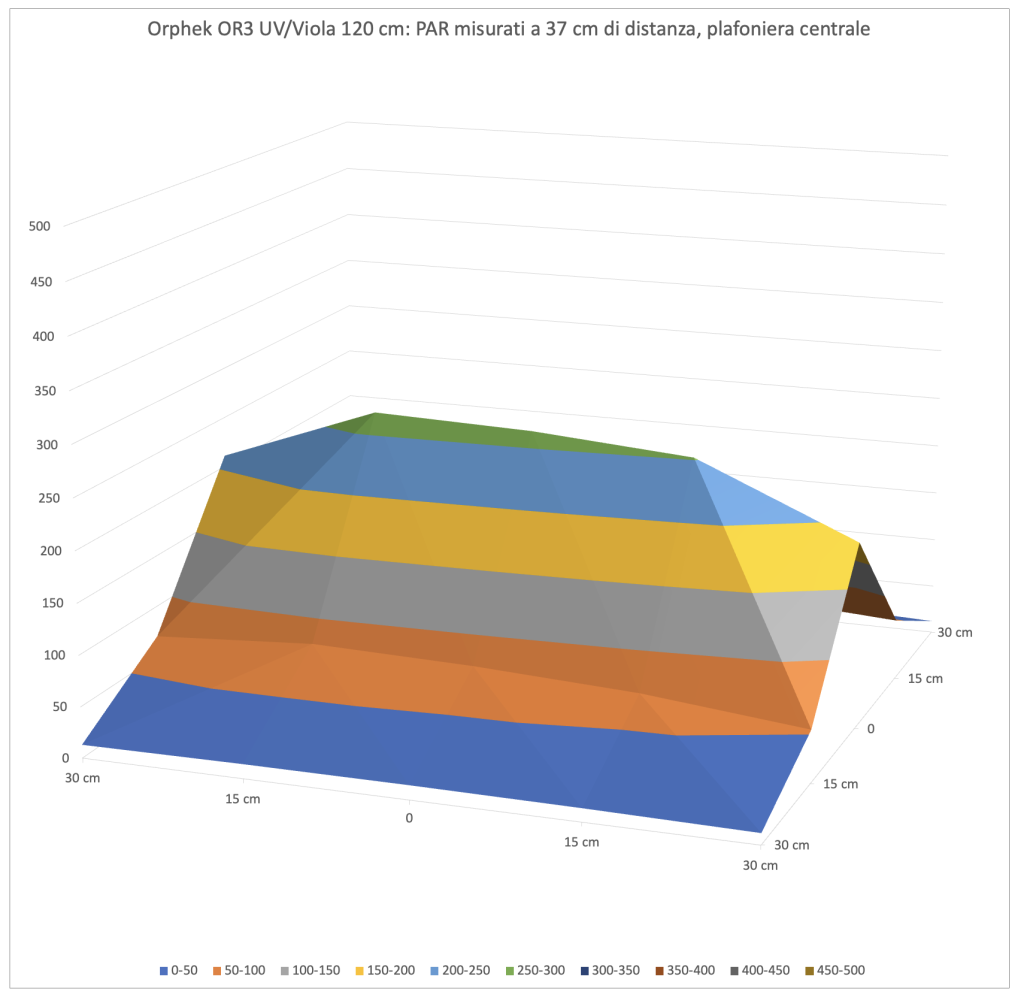

Even in this cas the PAR value is higher than any other LED bar. Pretty much higher than the old OR2.
PAR measurement from 57 cm of distance
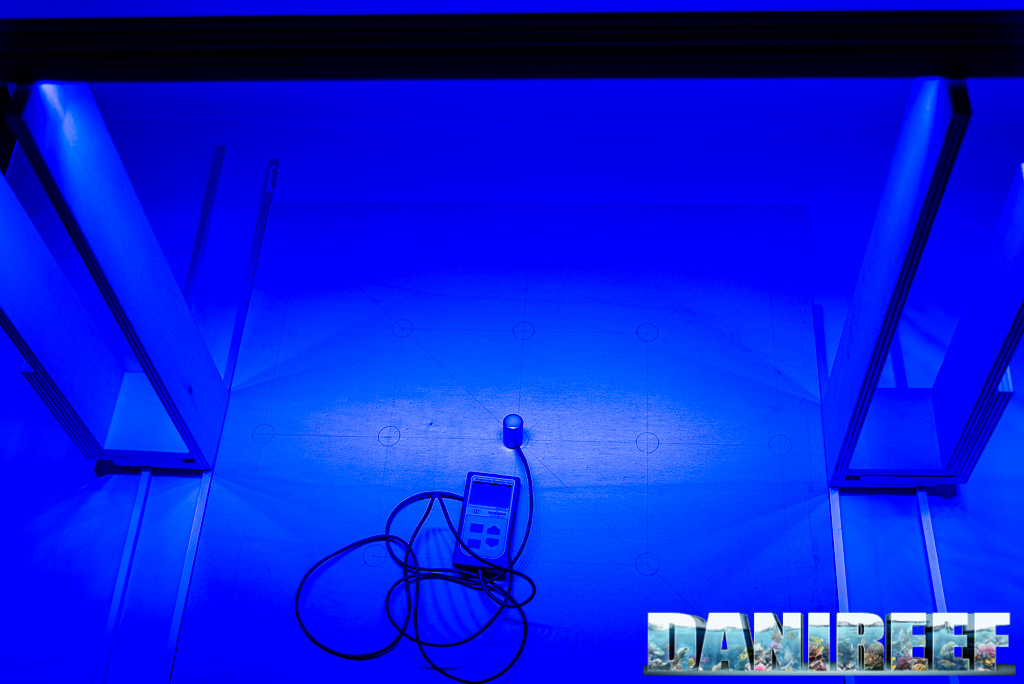
This is the condition of the test. Below there’s the chart, from this distance the device is very visible, and the bar (in this case it was a OR3 Blue Sky) is placed on the spacers. Even visually the illuminated area is wider, so the specific power per cm decreases.
Here are the collected values:
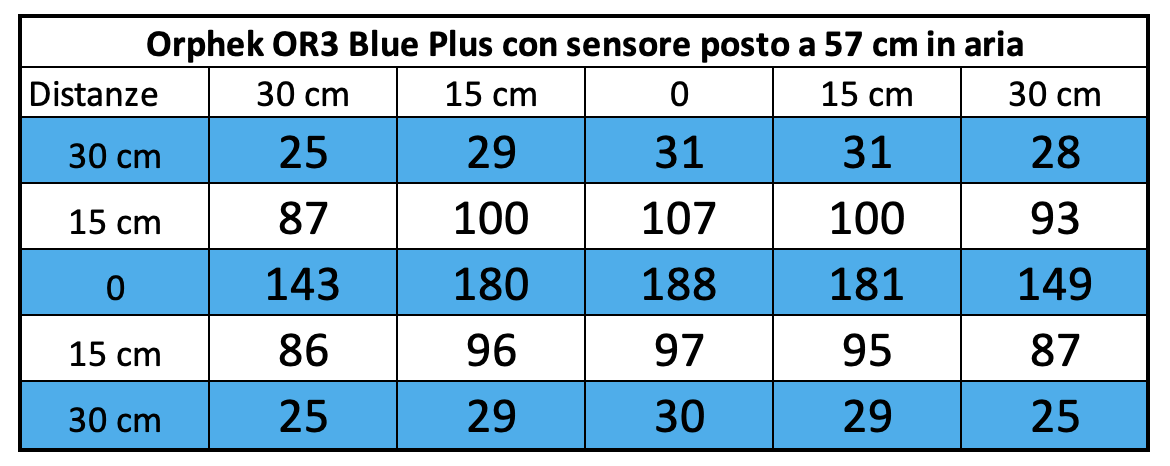
And that’s the corresponding chart.
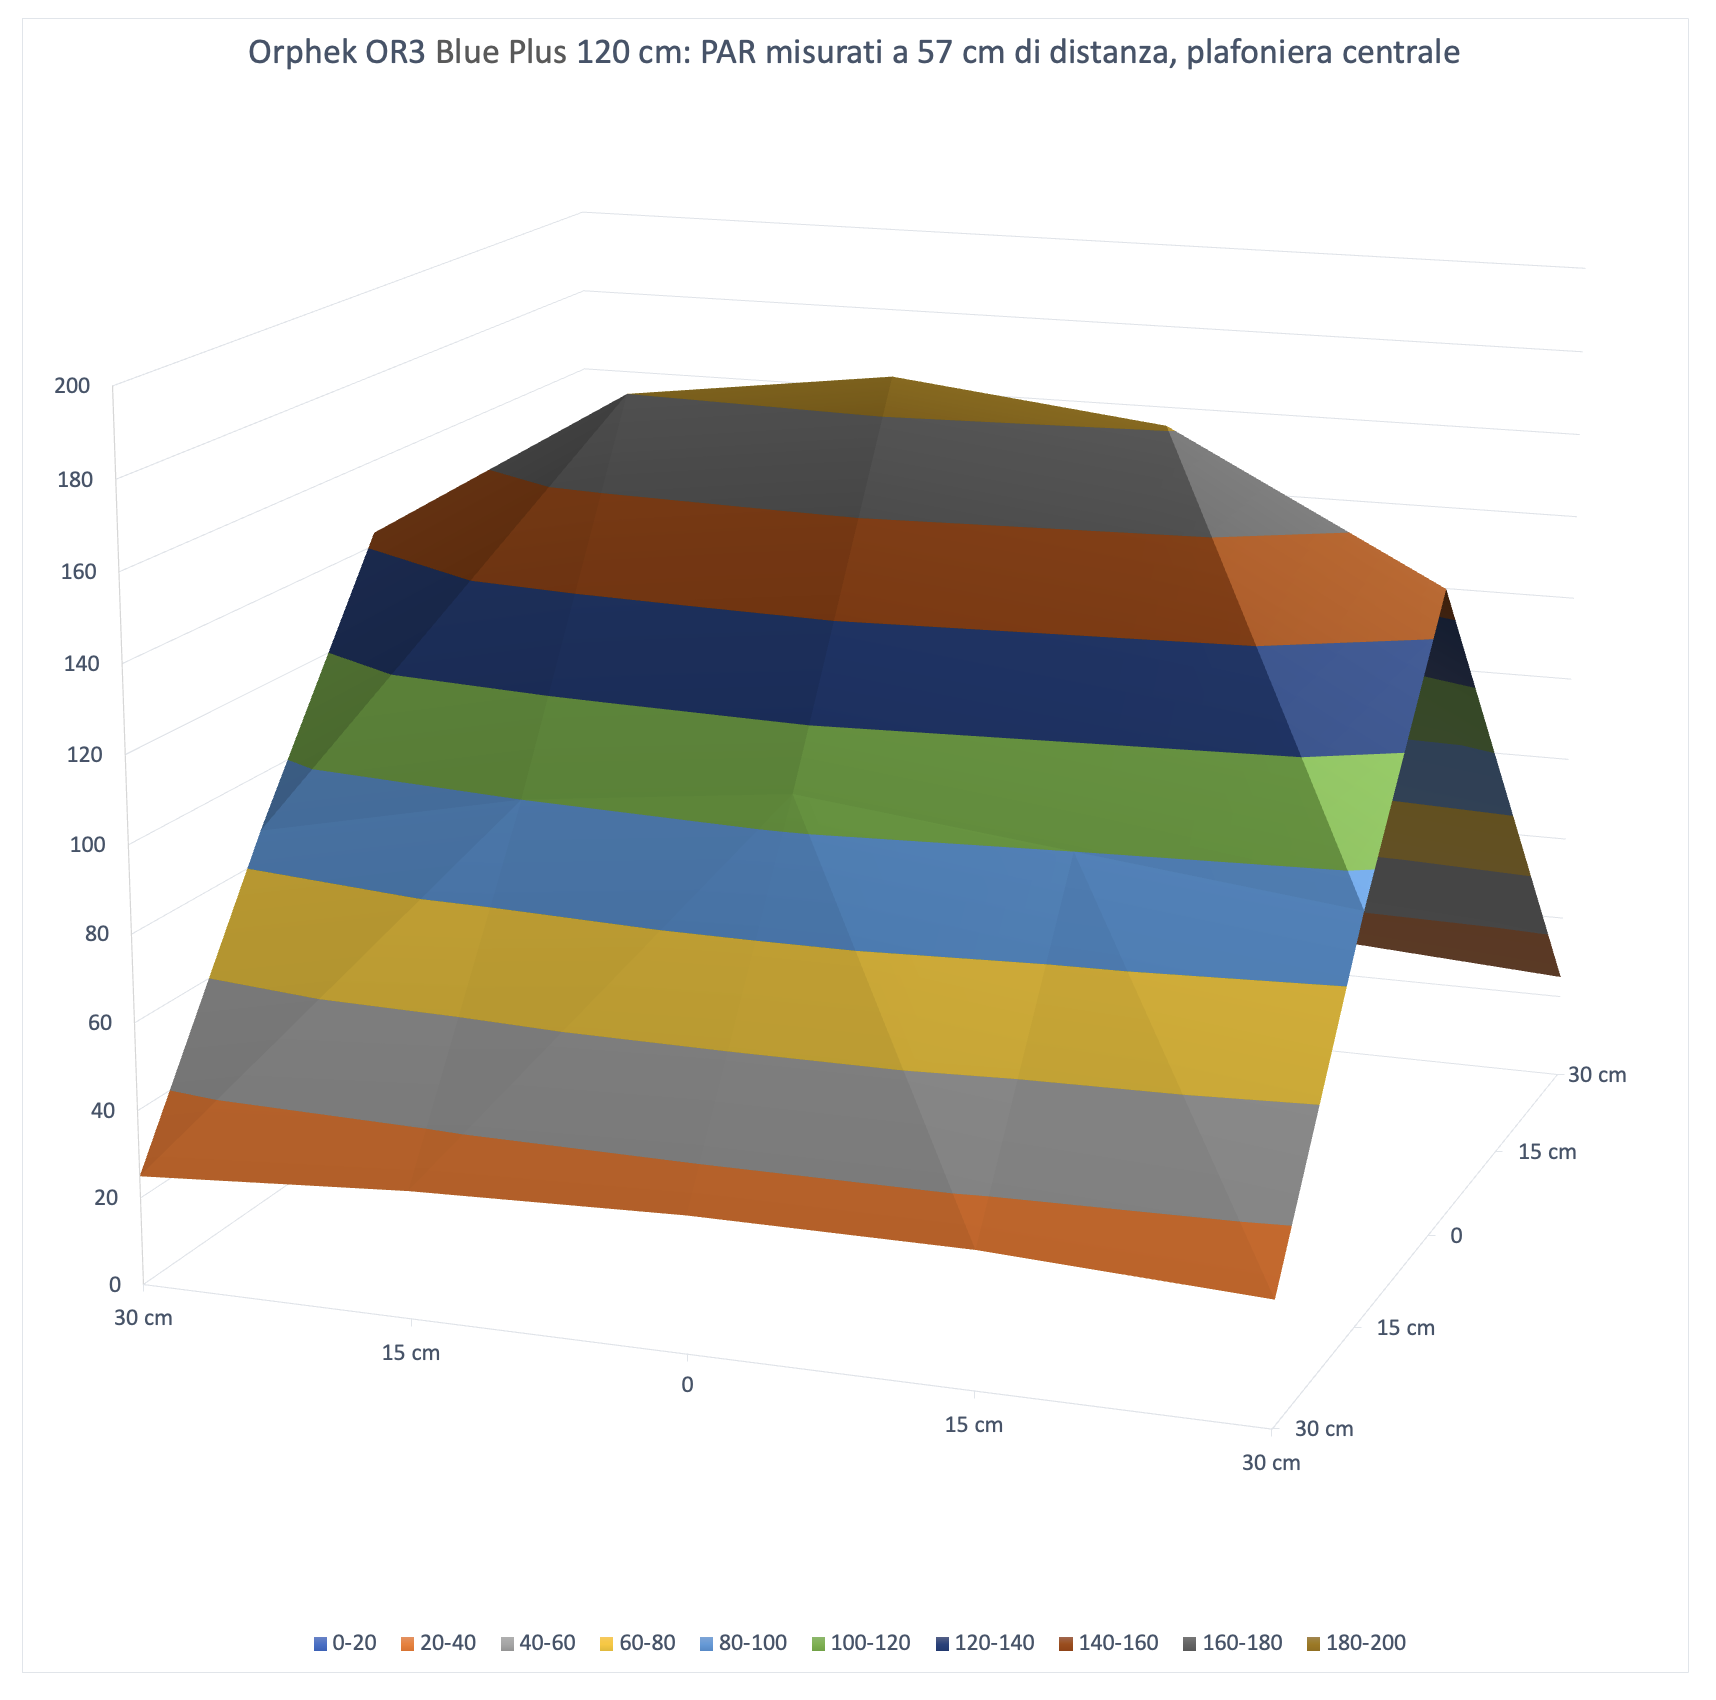
Increasing even more the space between ceiling light and sensor, the spatial distribution is still very uniform, with a small longitudianl drop that we expected. The uniformity is absolutely perfect. The value at the middle decreases again from 680 to 300 to 188 μmol m-2 s-1.
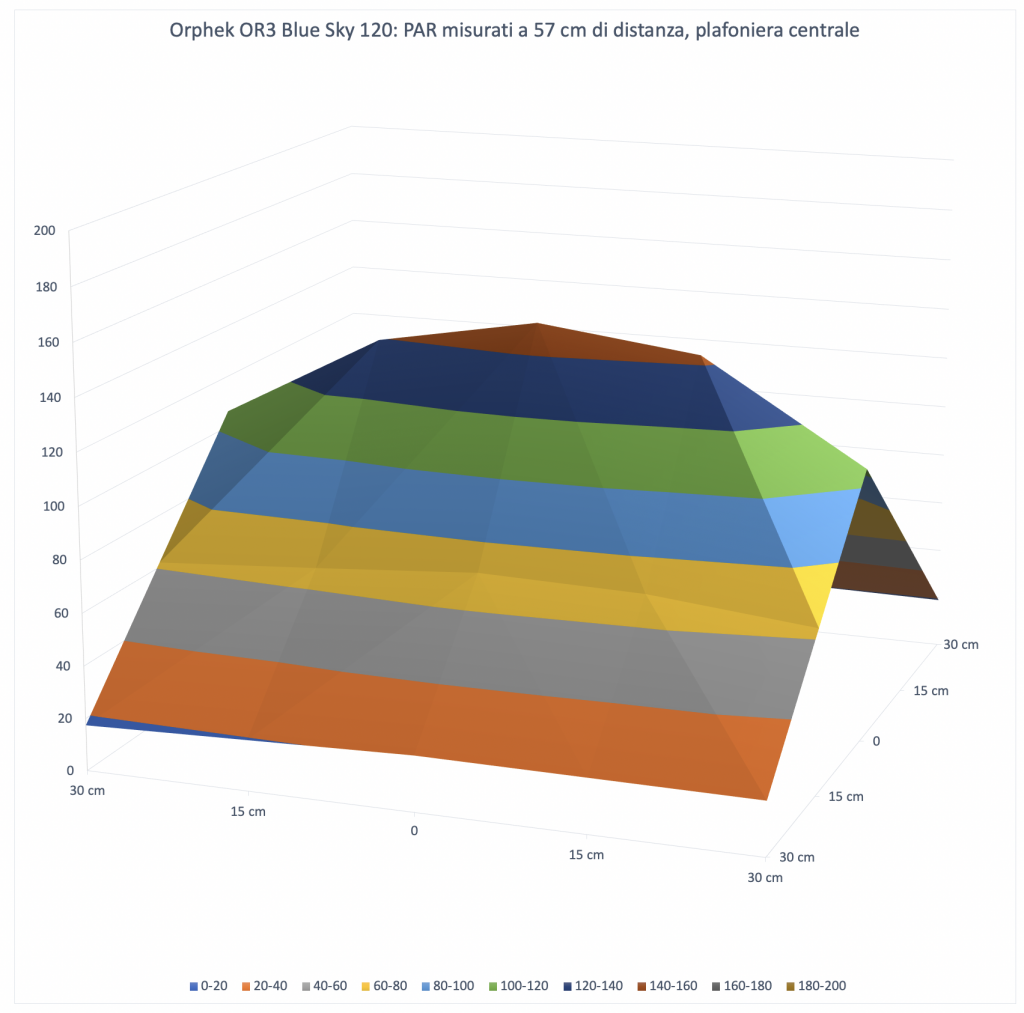

Even at 57 cm the OR3 Blue Plus is the one that expresses the higher number of PAR. Many steps higher than the ohers, especially the onld OR2.
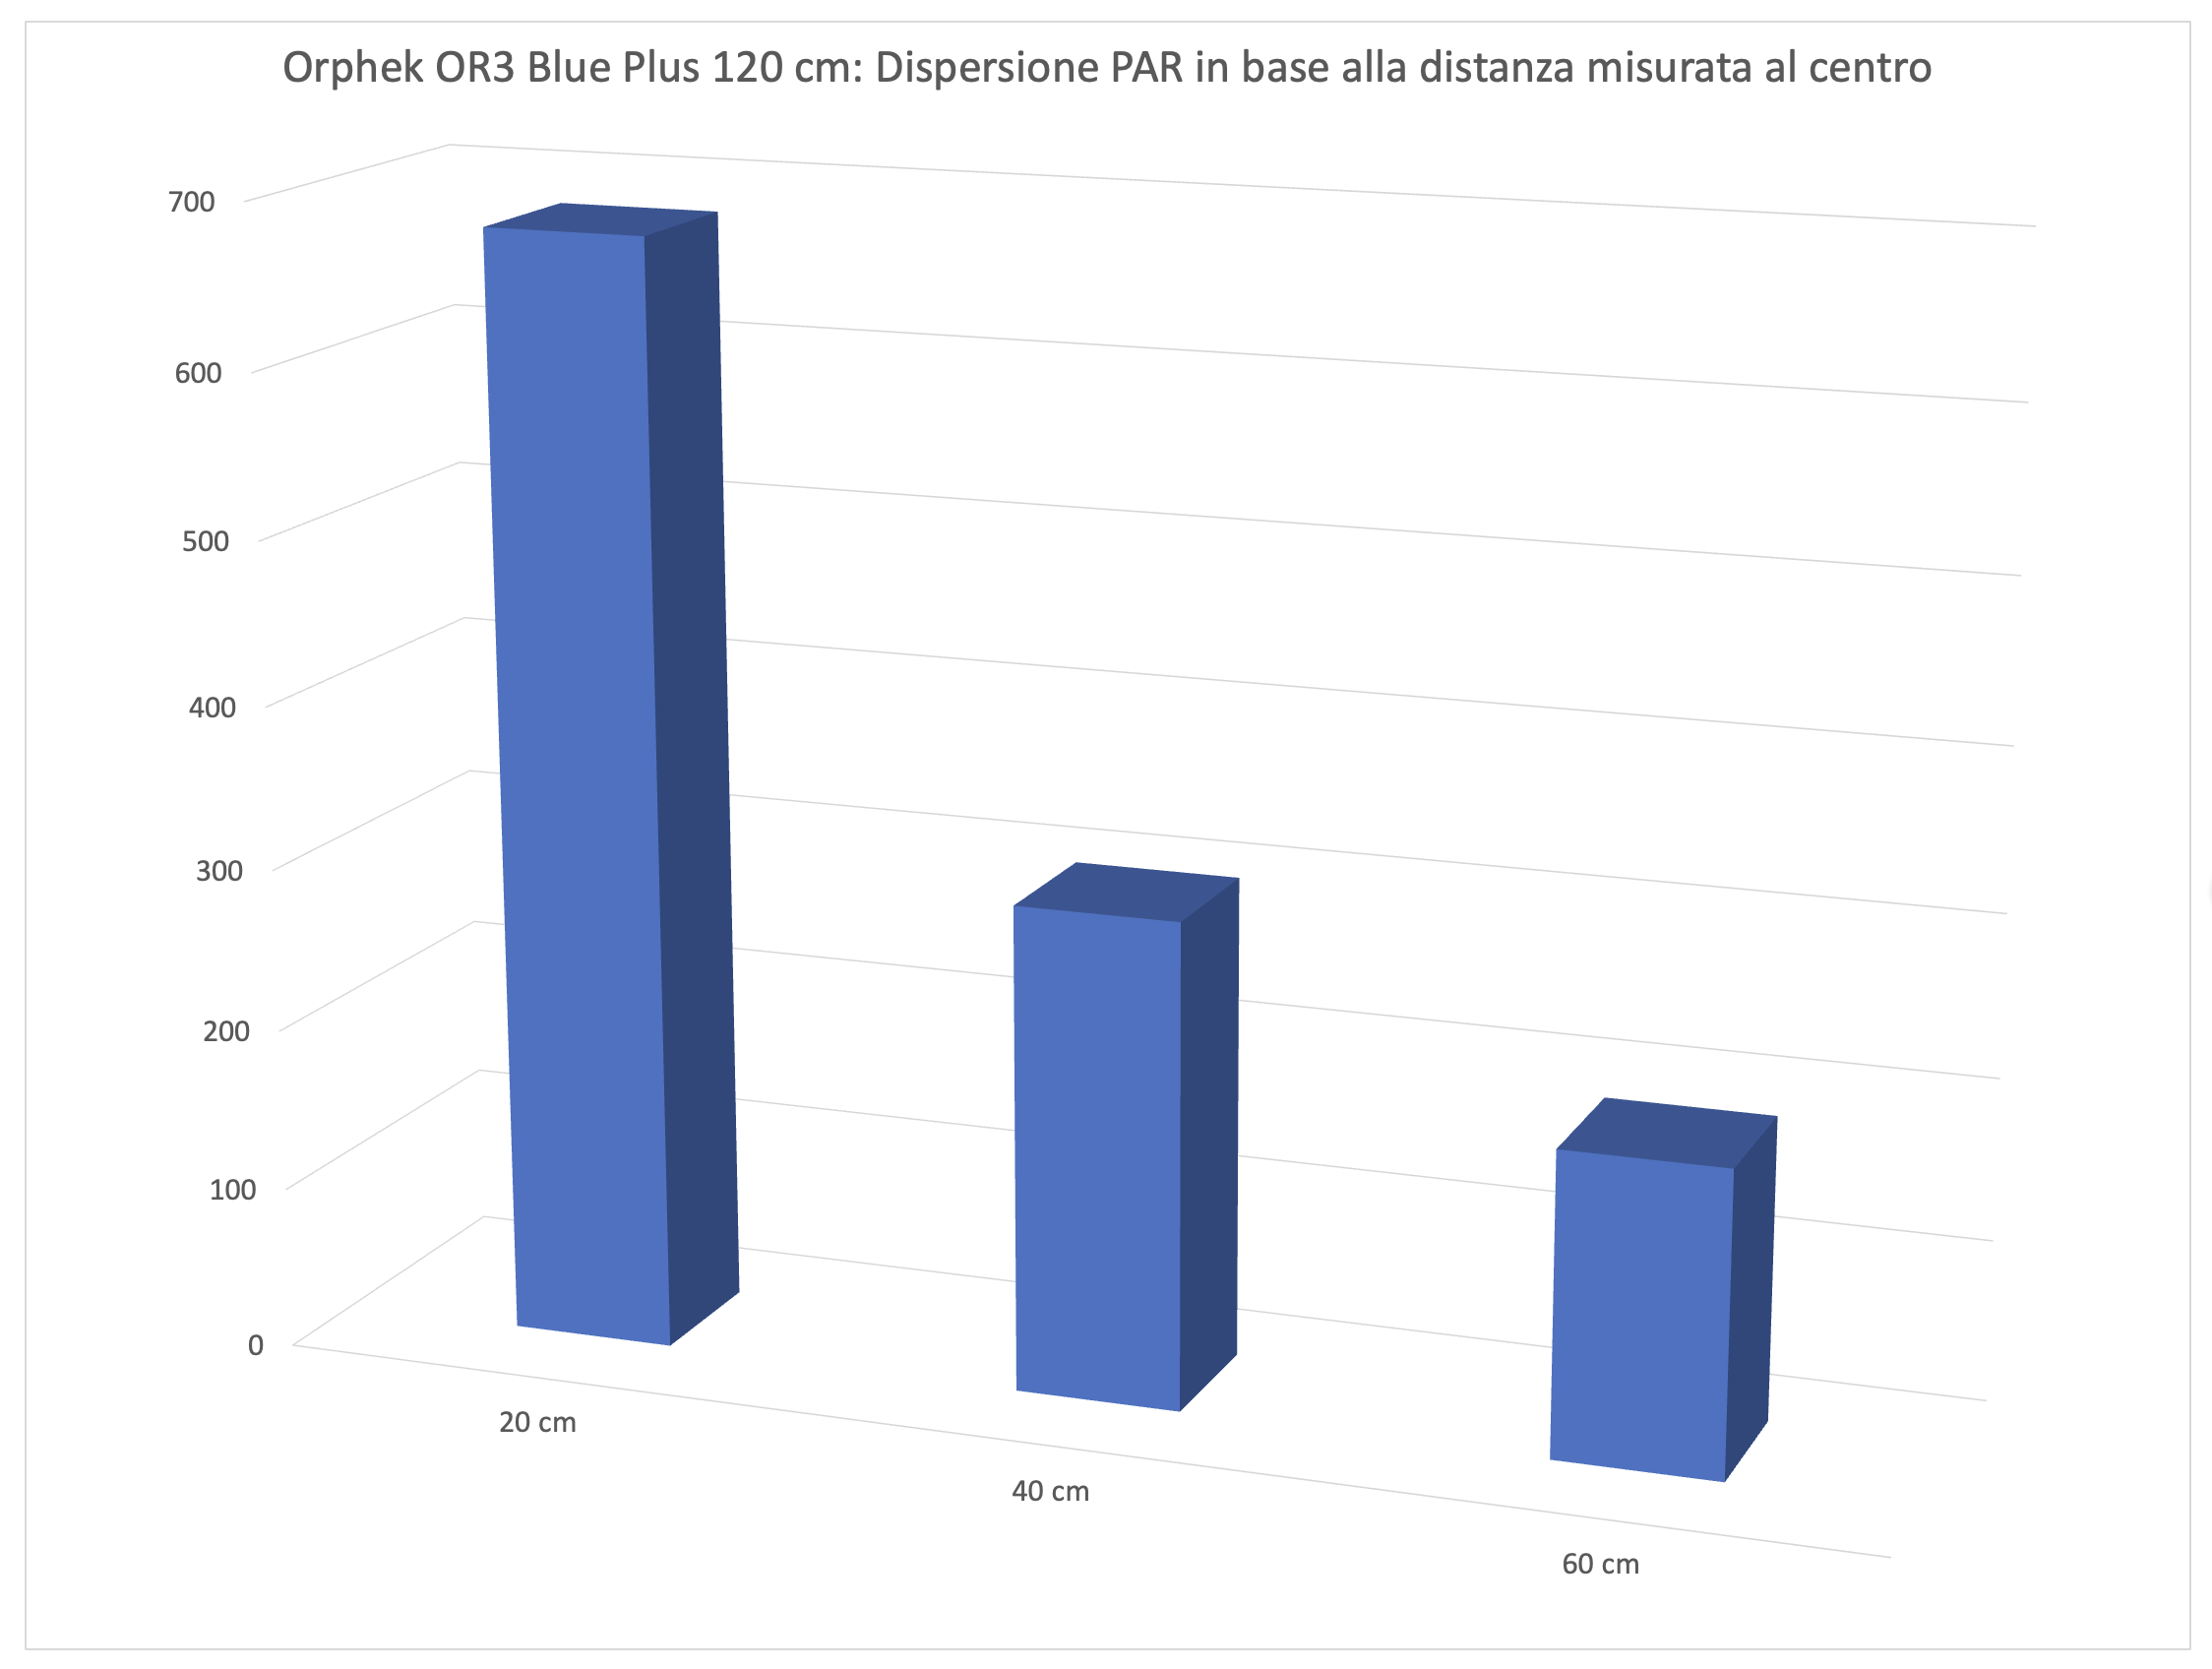
The PAR in the middle in the different configurations
Let’s continue with our technical measurements. We can see how, in a chart, the PAR collected in the middle decrease in the three different distances of the tests.
Energy variation of the LED bars Orphek OR2 Blue Plus depending on the distances
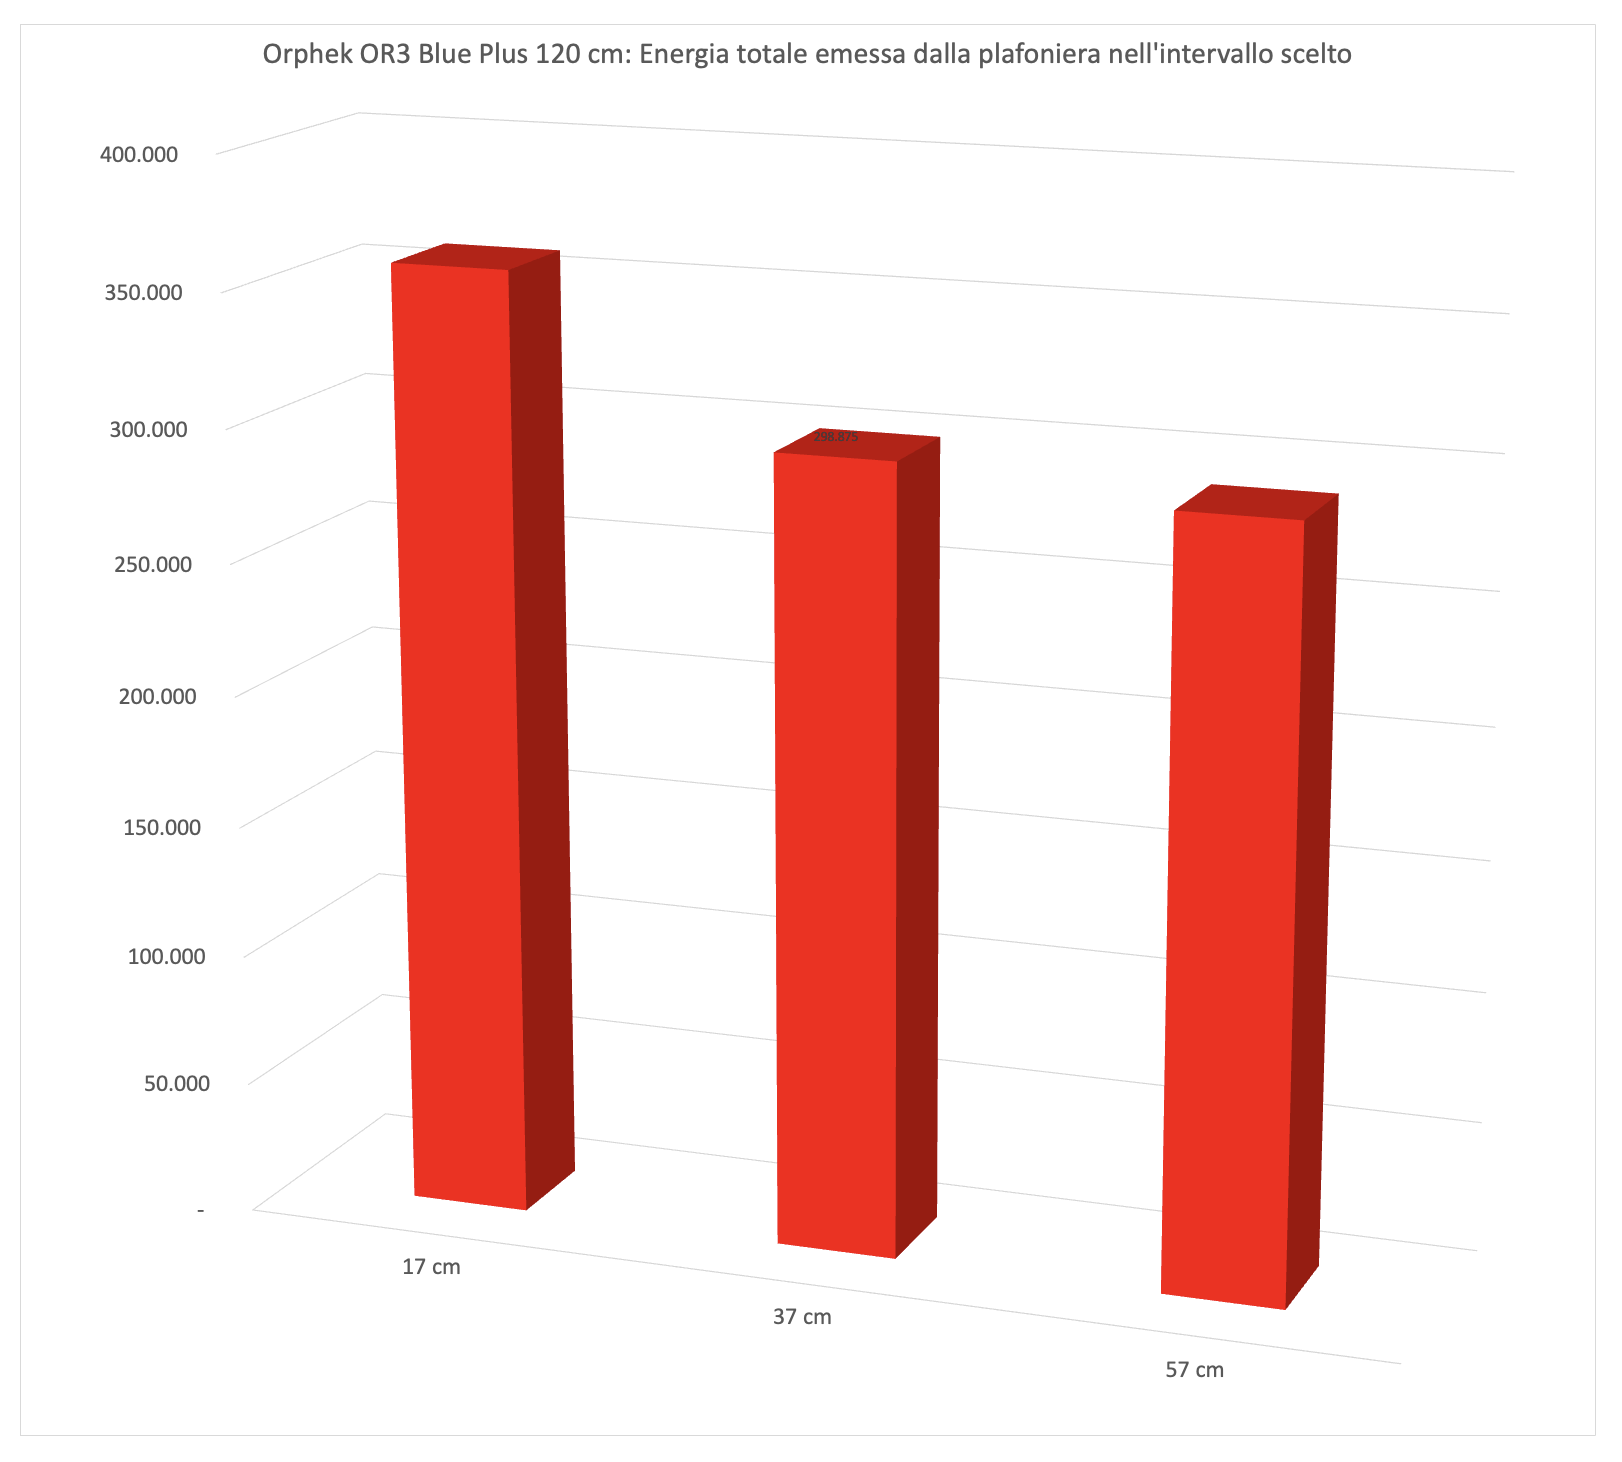
This is the most significant and most comparable data. The energy variation. We calculated the volumes of the three surfaces previously seen. It’s obvious that moving away from the ceiling light the PAR decrease, also because the light illuminates a wider space. We try to consider all the light energy in this square of 60 cm under the bar. And it’s visible that the three values of 358.000, 299.000 and 289.000 assume a different connotation compareed to the values in the middle. When the first ones decrease because the distances increase, the subtended area, that is the energy, decreases very slowly. The three areas are enough similar. Little energy is lost over the area.
Considering the values of the three curves you can see that on the sides there’s more light at 57 cm rather than 37. It’s also remarkable that the energy at 37 cm and 57 cm is basically the same.
Let’s continue on page three with the the costs, the comparison with other ceiling lights and our final opinion.
Scopri di più da DaniReef - Portale dedicato a Acquario Marino e Dolce
Abbonati per ricevere gli ultimi articoli inviati alla tua e-mail.


