


Our new DaniReef LAB method for PAR measurement
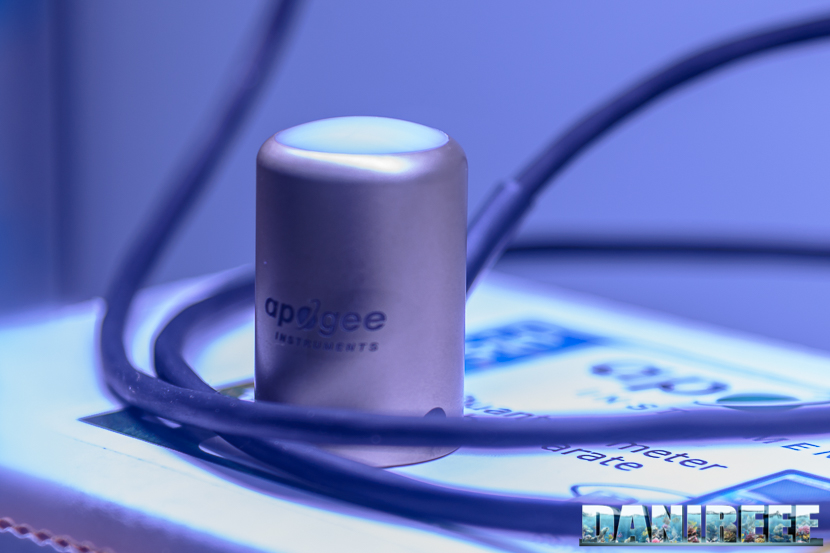
During the long nights on our forum (here) we have always wondered how to compare PAR values across different fixtures. Until today we did it using the Apogee Quantum Meter MQ-510.

The Quantum Meter MQ-510 measures PAR, expressed as PPFD — photosynthetic photon flux density — in μmol m-2 s-1. This instrument is calibrated to work underwater, so when used in air the measured value must be divided by 1.32, the immersion factor. Since there was no water present when taking the measurements you will see below, we applied that conversion. The values you see are always the corrected ones.

We therefore decided to build a 70×70 cm test bench, marking 17 fiducial points where to place the MQ-510 sensor. To position the fixture we created risers at 20, 40, and 60 cm, so we always read with the same sensor-to-light distance. This allows us to create comparable spatial curves for different fixtures at those same distances. Note that distance is measured between the base of the sensor and the base of the fixture. In practice, the distance must be reduced by 3.5 cm (sensor cylinder height) and increased by 0.5 cm (the spacers that keep the light slightly raised).
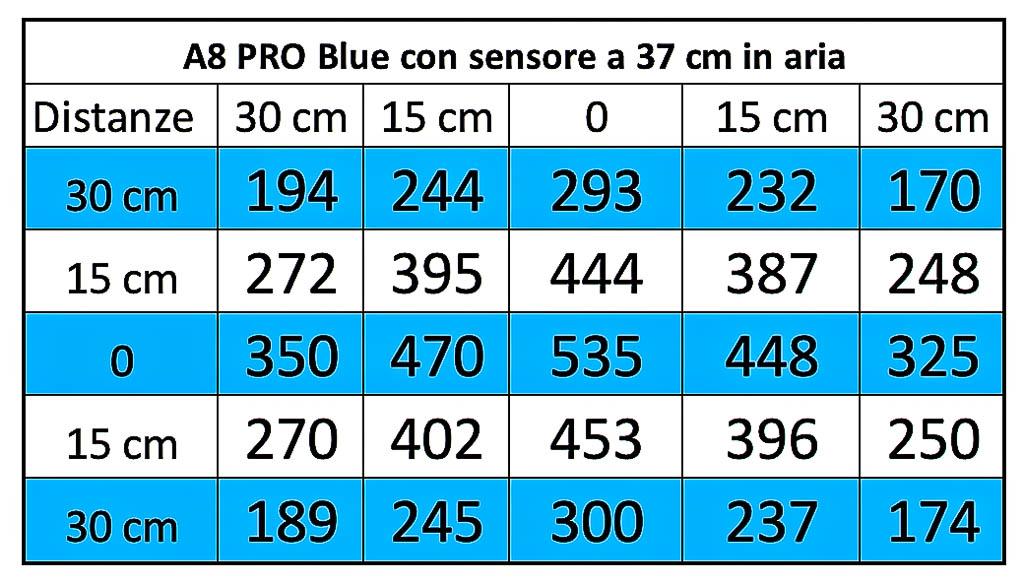
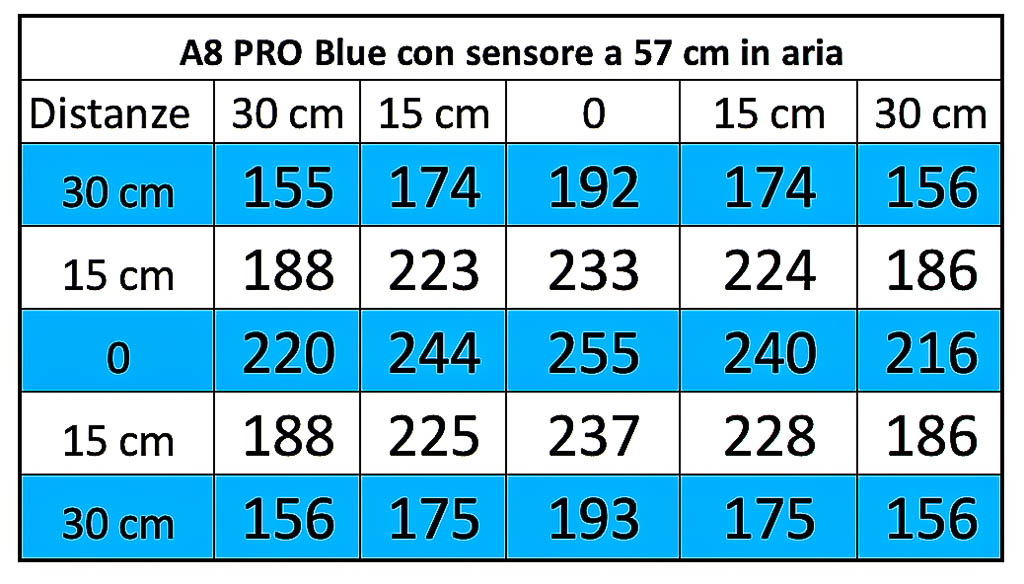
In total, the three measurements are therefore taken at 17, 37 and 57 cm in air, applying the correction factor.
Alongside this system we also use the new ITC PARwise PRO, which measures PAR and also provides spectral analysis and, crucially, the cPUR. The cPUR — “Coral Photosynthetically Usable Radiation” — is a light measurement specifically designed for corals. According to ITC, raw PAR doesn’t tell us whether the measured light is actually useful for coral growth. You may have a high PAR level, but concentrated entirely in the wrong part of the spectrum.
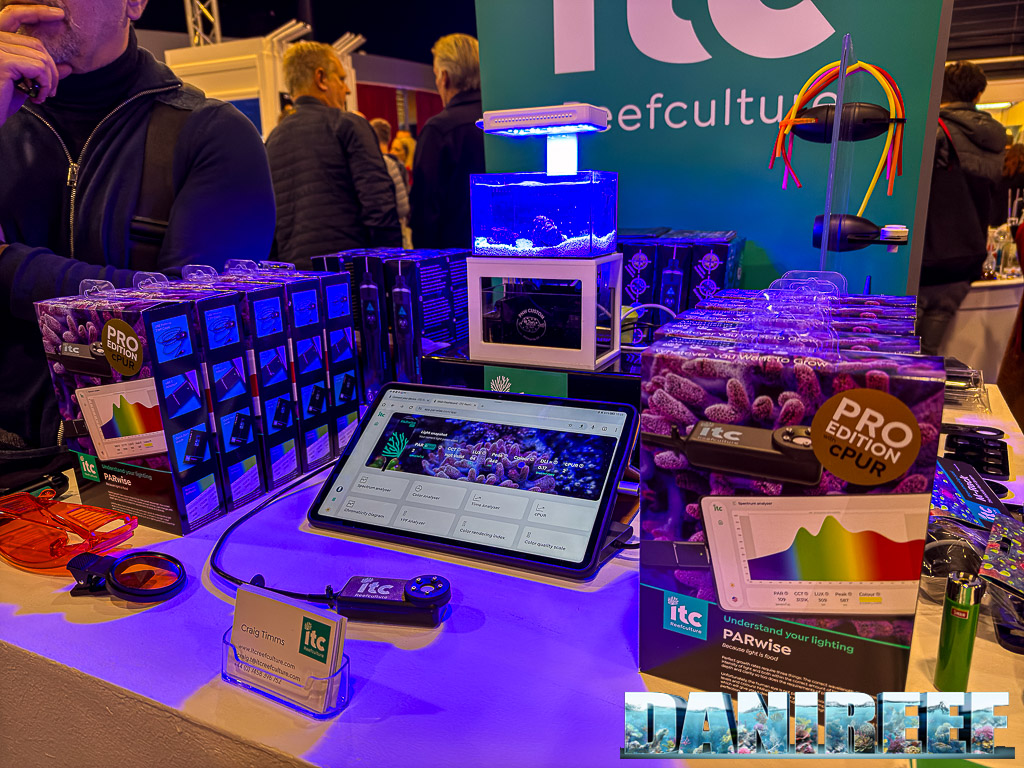
The cPUR calculation includes only wavelengths and intensities that corals can effectively use, excluding those that are not efficiently exploited in photosynthetic processes or fluorescent proteins. Obviously, it represents an average.
With the latest software release for PARwise PRO we can also read many other interesting characteristics, from spectral shape to pigment responses. We’ll look at all of that later in our analysis.
PAR measurement at 17 cm distance
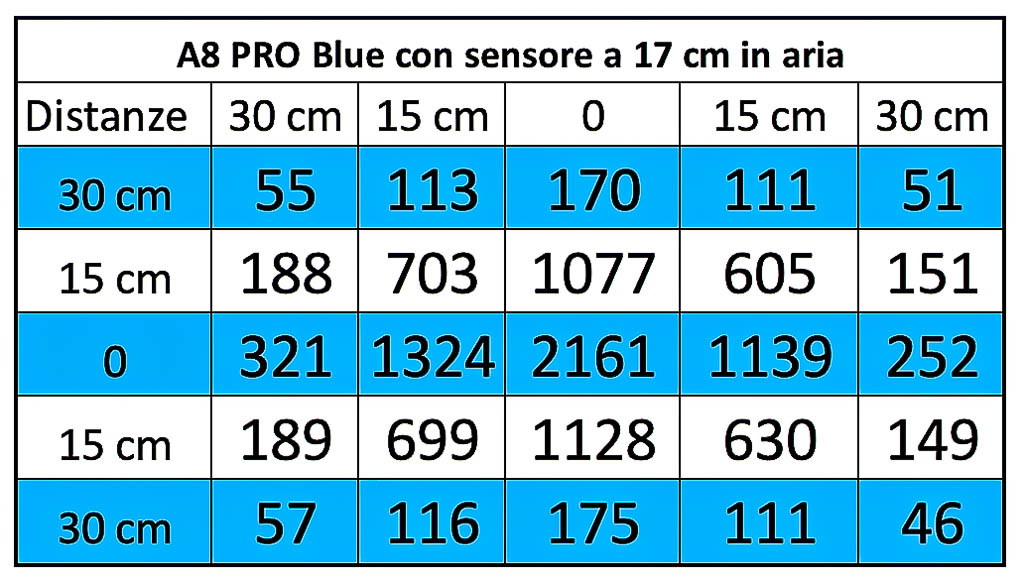
And here is the corresponding chart, using our standard scale — the same for every fixture — so similar fixtures can be directly compared.
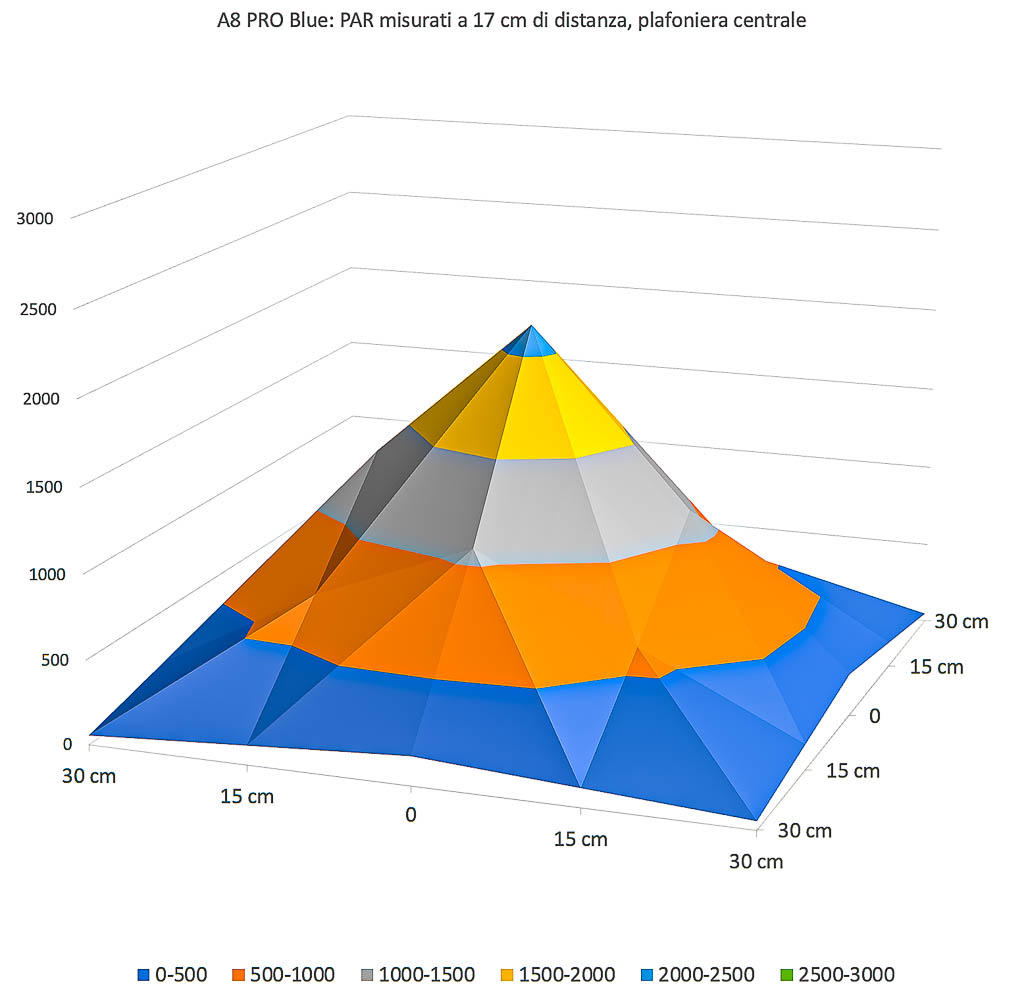
The first reading has a limited distance between fixture and sensor. PAR levels are very high at the center and show the classic “circus tent” profile. This is obvious considering the fixture’s size of 30×18 cm.
PAR measurement at 37 cm distance
And here is the corresponding chart.
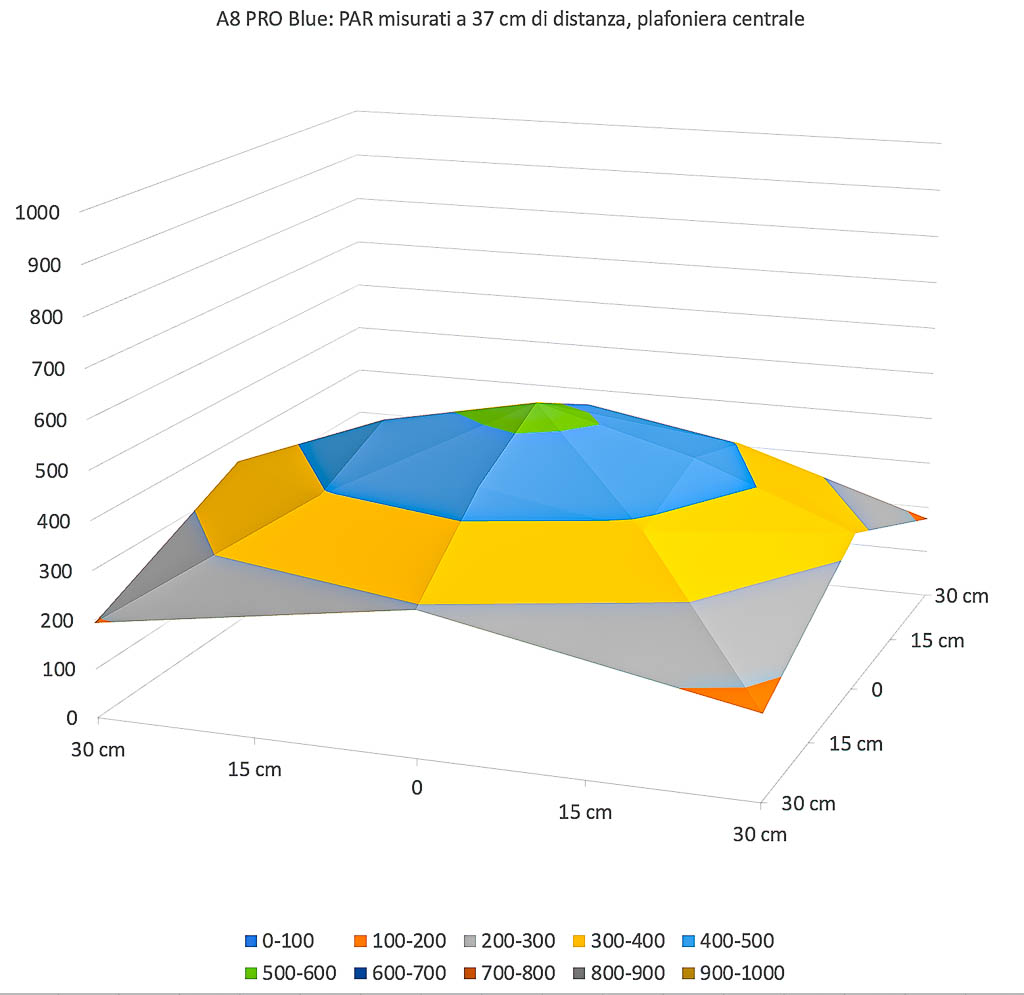
As the distance increases, the curve fills out. The peak value remains very high. The central value drops from 2,161 to 535 μmol m-2 s-1.
PAR measurement at 57 cm distance
And here is the corresponding chart.
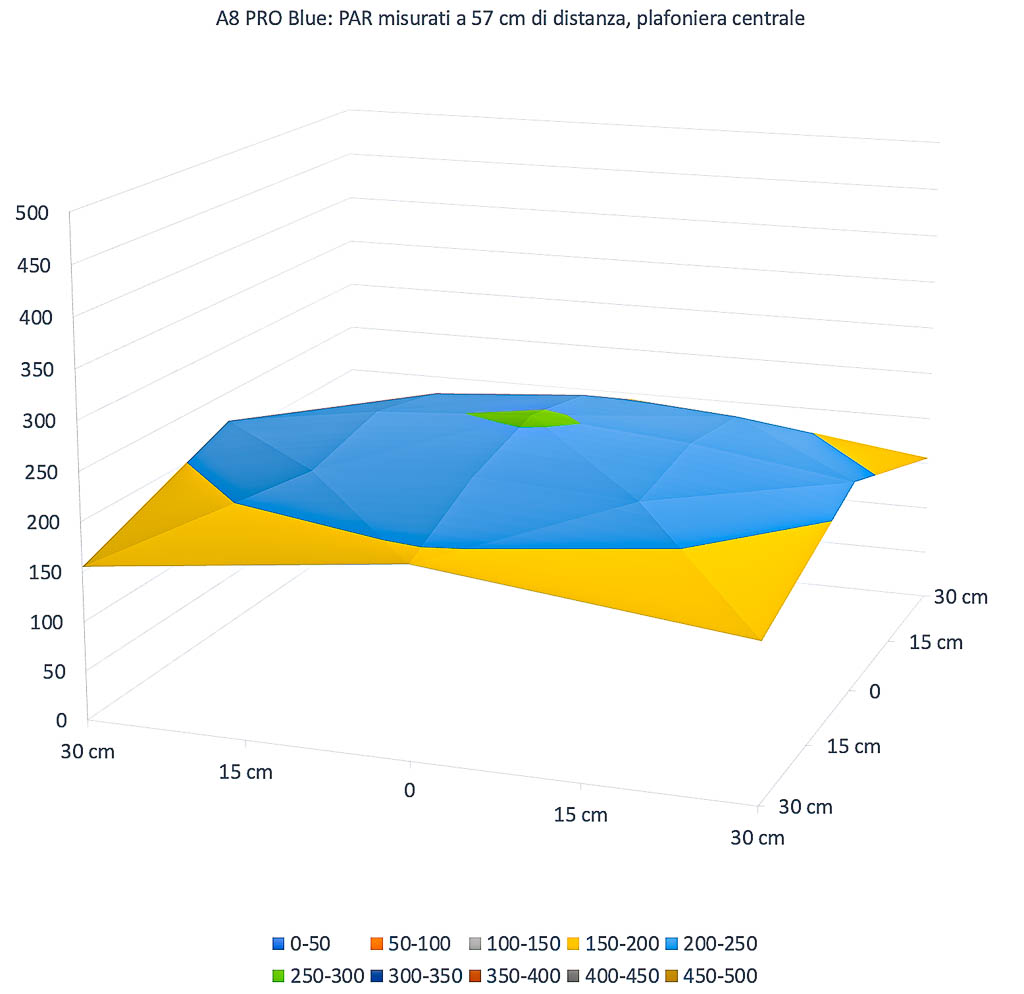
Just by looking at the chart you can see full coverage with high PAR levels, considering we’re talking about a distance of 57 cm from the fixture. An incredible result in terms of coverage pattern. The central value drops again from 2,161 to 535 to 255 μmol m-2 s-1.
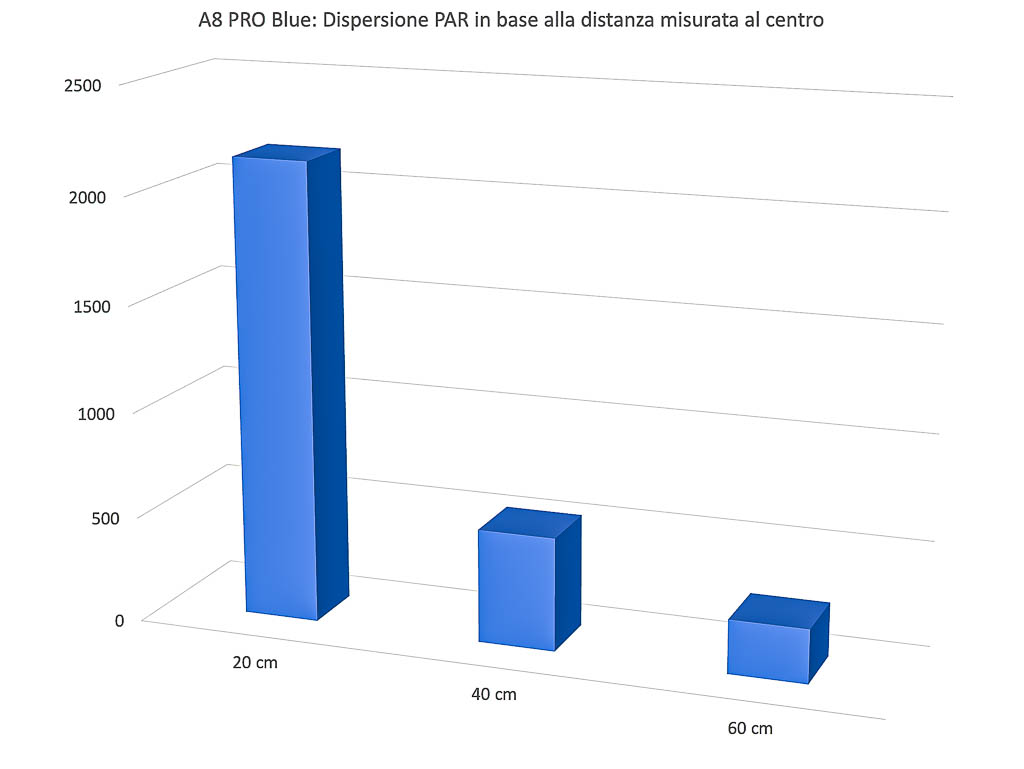
Central PAR at the three distances
Let’s continue with the technical readings. Below you can see, in a single chart, how the central PAR values decrease across the three test distances.
A8 Pro II Blue energy variation by distance
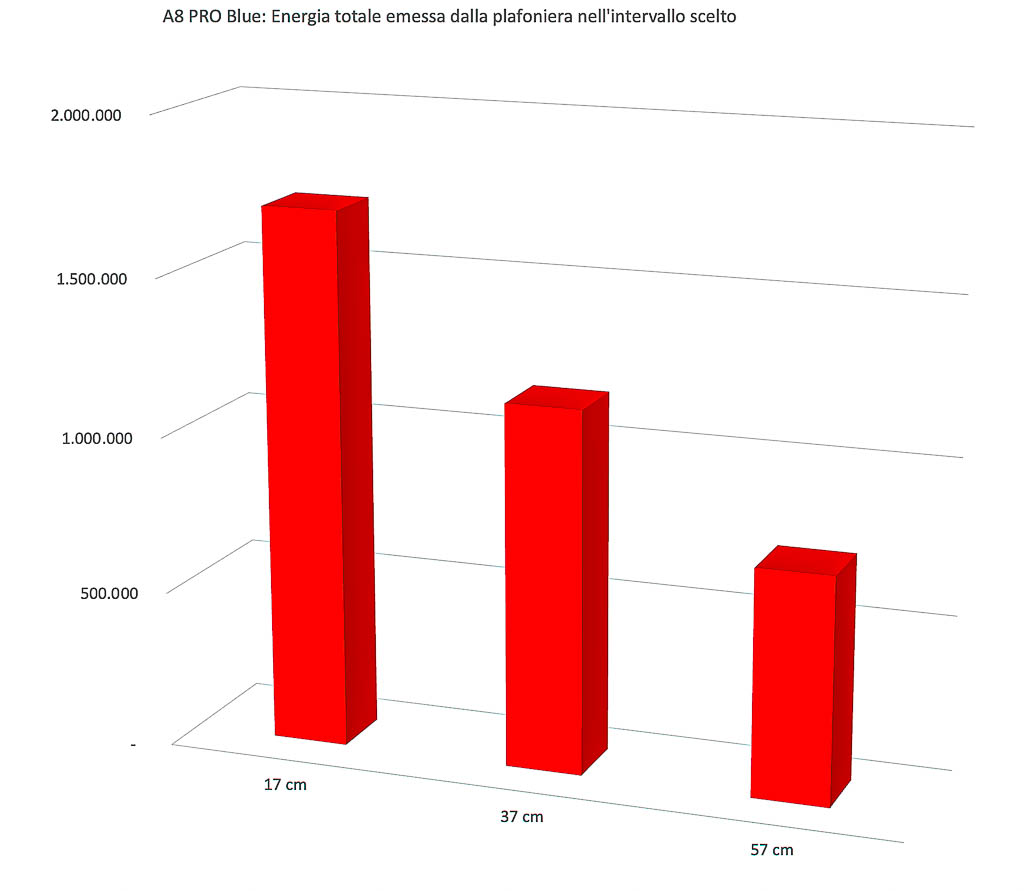
In my opinion this is the most significant and comparable metric we measured: the energy variation. We calculated the volumes under the three surfaces you saw earlier. Obviously, as you move the fixture farther away, PAR decreases — but it also decreases because the light covers a wider area. This calculation attempts to account for all the light energy contained within the hypothetical 60 cm square under the fixture. The three values — 1,709,000; 1,158,000; and 725,000 — take on a different meaning compared to central readings. While peak PAR drops with distance, the “bulk” of the concentrated illumination remains around the center, so the total “energy” drops less. That’s the theory.
For the A8 PRO II Blue these values are very consistent, even as distribution goes from strongly centered to fairly even across the surface. Depending on the animals you keep, this is excellent for tanks up to 60 cm wide, and good for aquariums 70–80 cm wide. Keep in mind that although coverage is good, light rays will hit the sides at a steep angle in wider tanks, so the effect on corals will differ from that of a broader-panel fixture like ATI Straton, GNC BluRay X, or Philips CoralCare.
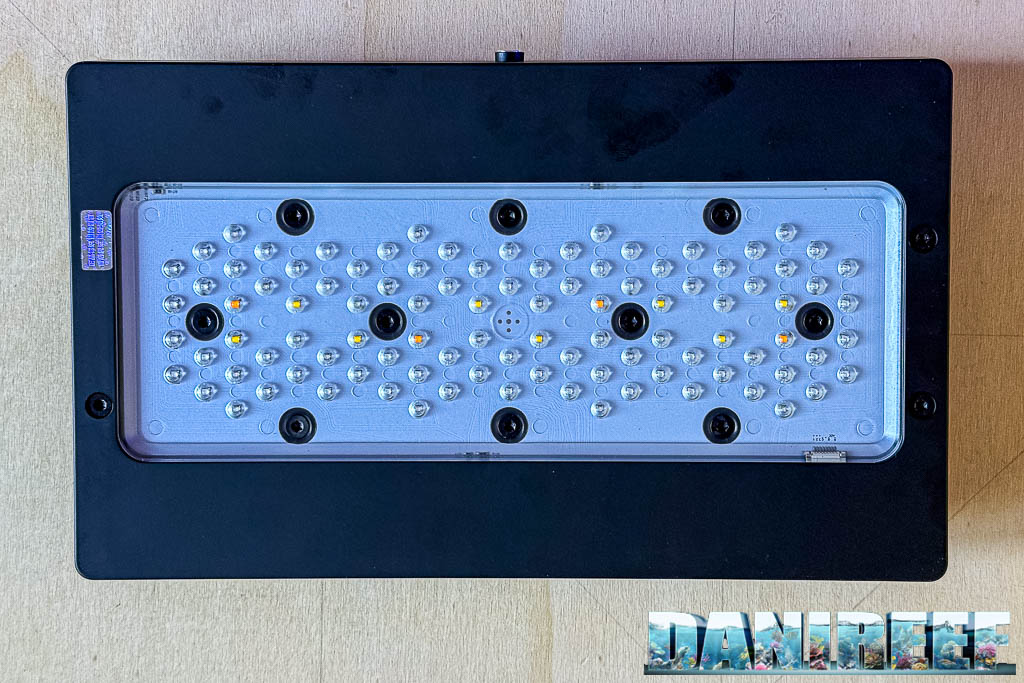
The A8 Pro II Blue light spectrum
Thanks to the ITC PARwise PRO we also measured other values, including the light spectrum and the important cPUR.


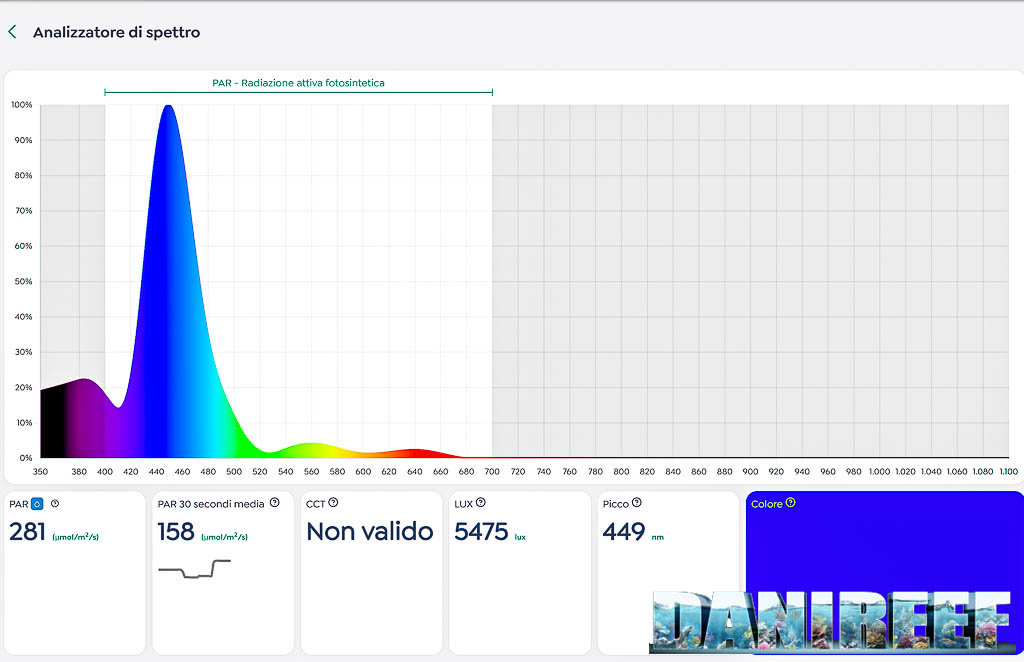
Above you can see the spectrum as measured by the PARwise PRO. The spectrum is reconstructed from discrete sampling points, so the curve is not as “perfect” as that from a high-end spectroradiometer; nevertheless, it gives a sufficiently accurate idea and shows a marked prevalence around 449 nm, where it achieves maximum PAR.
The spectrum appears virtually identical at the three distances considered and indicates maximum lux and PAR, summarized in the following table.
| PAR | LUX | |
| 17 cm center | 2208 μmol m-2 s-1 | 43043 lux |
| 37 cm center | 586 μmol m-2 s-1 | 11270 lux |
| 57 cm center | 281 μmol m-2 s-1 | 5475 lux |
These values, measured at the center, are about 2% higher than those measured with the Apogee MQ-510.
cPUR of the A8 Pro II Blue
Below is the green curve indicating cPUR — Coral Photosynthetically Usable Radiation — i.e., the maximum photosynthetically usable radiation for corals. As said, cPUR is designed specifically for corals: raw PAR may be high but concentrated in the wrong spectral region.
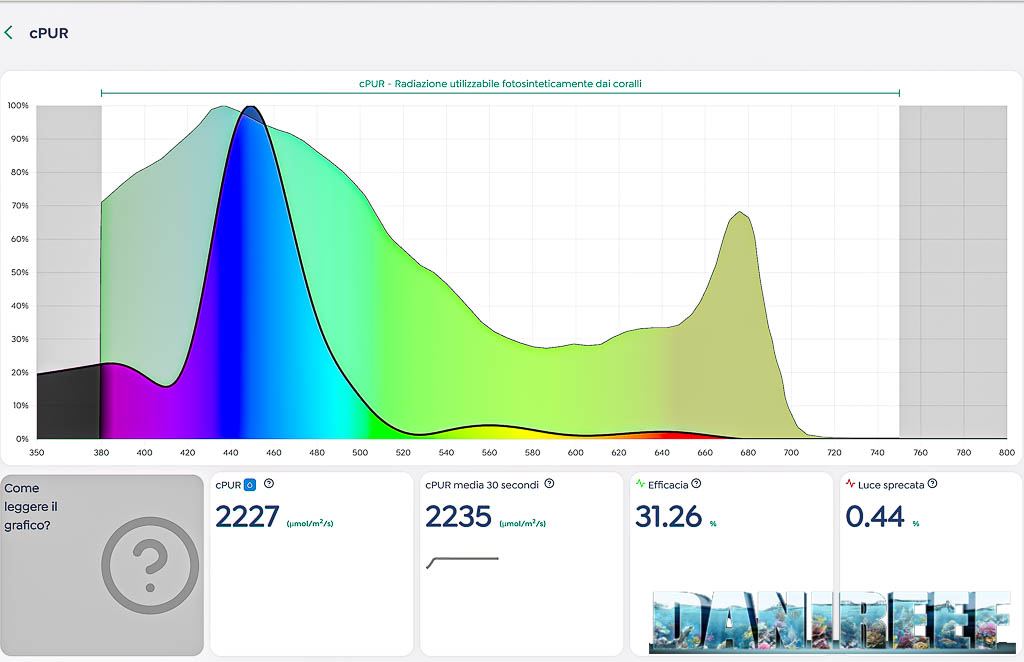

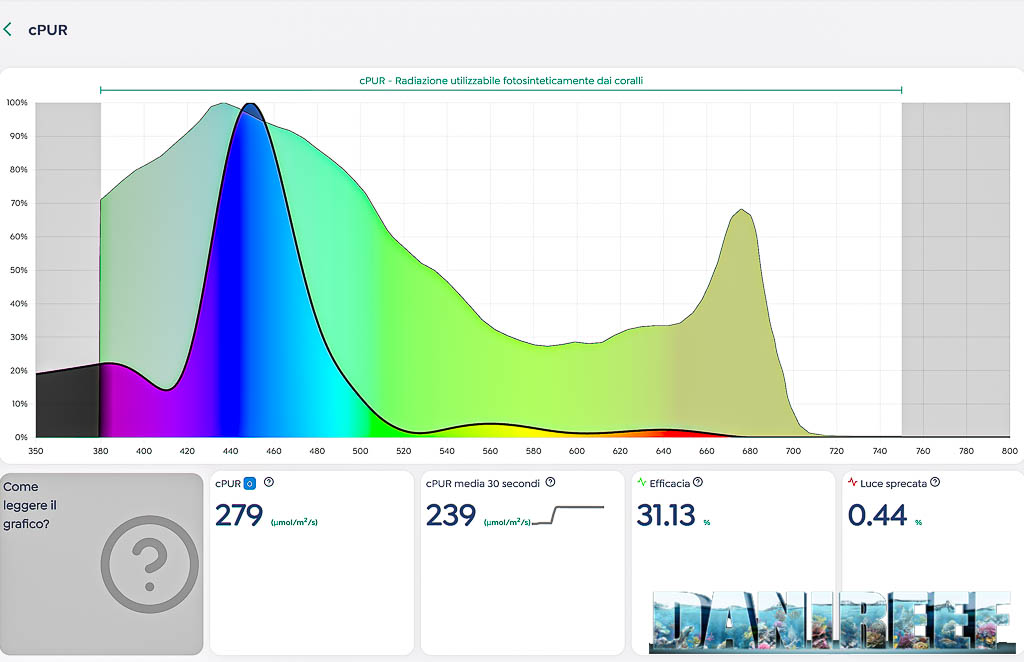
We can see that the spectrum of the A8 Pro II Blue lies entirely beneath that hypothetical cPUR curve. In practice, there’s virtually no dispersion of light that corals can’t use — and that’s what matters. The reading indicates that only about 0.44% of the total power is spent without benefiting corals. It must be said, however, that according to this curve the fixture meets only 31% of corals’ needs.
Pigments of the A8 Pro II Blue
The new PARwise PRO software also allows us to explore pigment excitation under the light. For now, we’ll take the data as-is; when we collect more fixtures we’ll be able to compare them meaningfully.


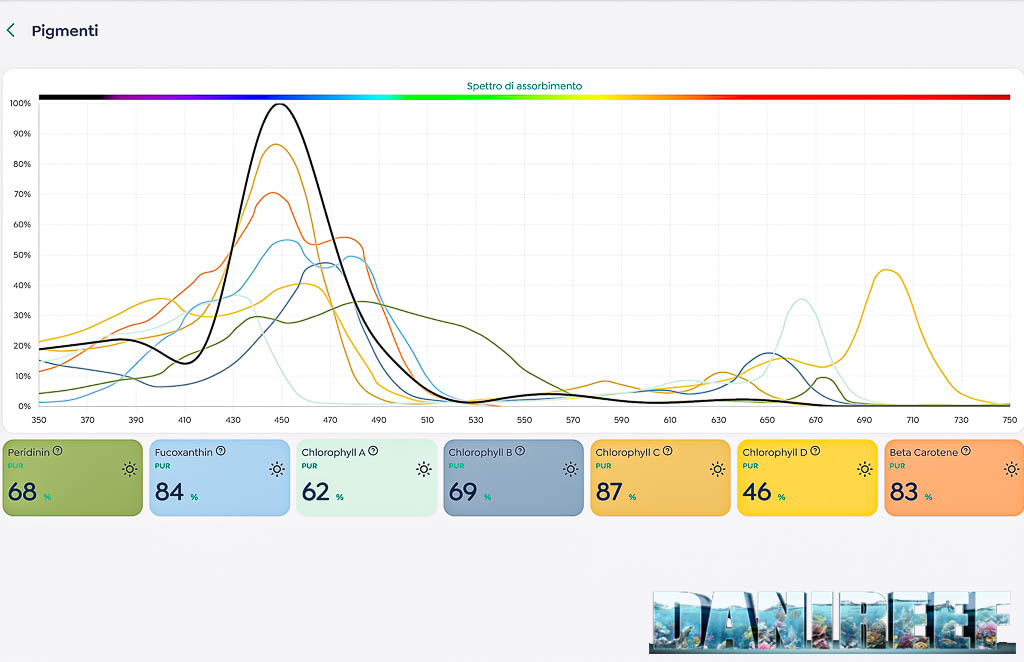
| Pigments | at 17 cm | at 37 cm | at 57 cm |
| Peridinin | 69 % | 68 % | 68 % |
| Fucoxanthin | 86 % | 85 % | 84 % |
| Chlorophyll A | 63 % | 63 % | 62 % |
| Chlorophyll B | 70 % | 69 % | 69 % |
| Chlorophyll C | 88 % | 87 % | 87 % |
| Chlorophyll D | 47 % | 46 % | 46 % |
| Beta Carotene | 84 % | 83 % | 83 % |
As you can see, the characterization is similar at all distances, while the impact of the various pigments changes a lot with the active channel (as verified by our readings), which we avoid including here not to overload you with data.
Per-channel values at the center for the three distances
We also measured values for each single channel, but only at the center, to give you an idea of each channel’s contribution to emitted PAR.
Here are the measured values:
| Distance = 17 cm | % of PAR | % of power | |
| Channel 1: | 457 μmol m-2 s-1 | 20 % | 19 % |
| Channel 2: | 452 μmol m-2 s-1 | 20 % | 20 % |
| Channel 3: | 79 μmol m-2 s-1 | 3 % | 4 % |
| Channel 4: | 77 μmol m-2 s-1 | 3 % | 7 % |
| Channel 5: | 702 μmol m-2 s-1 | 30 % | 23 % |
| Channel 6: | 181 μmol m-2 s-1 | 8 % | 10 % |
| Channel 7: | 164 μmol m-2 s-1 | 7 % | 10 % |
| Channel 8: | 191 μmol m-2 s-1 | 8 % | 8 % |
If we plot the PAR values in a chart, the difference becomes even clearer.
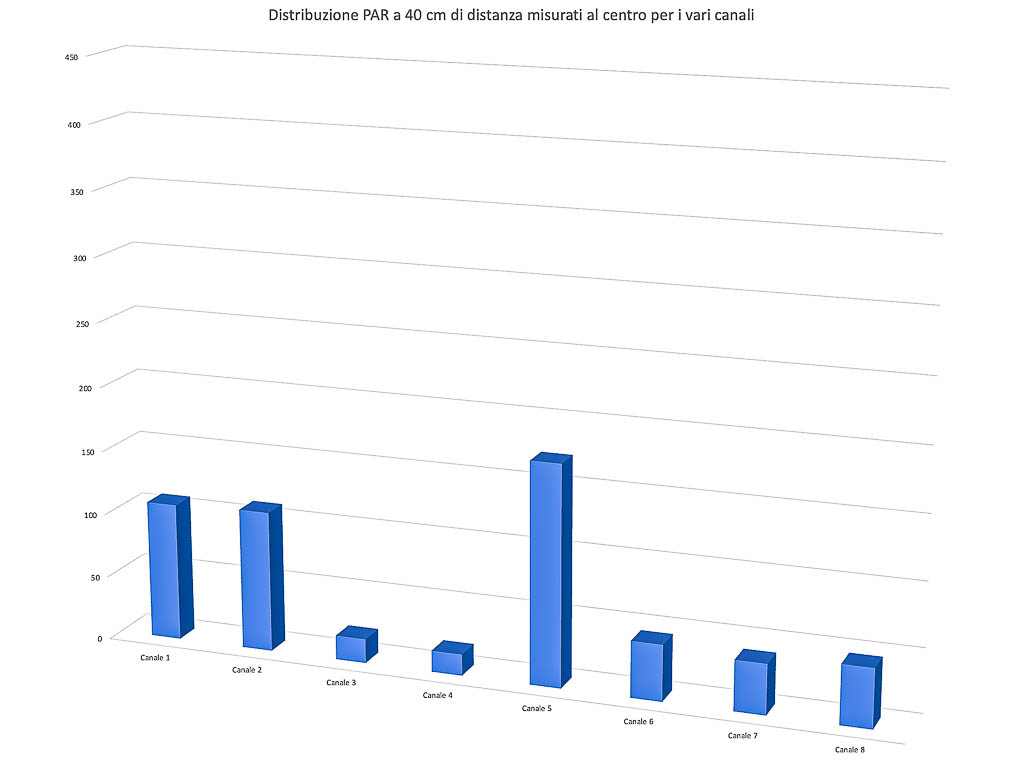
The eight channels appear (un)balanced at 3 vs 5. The heavy lifters are Channels 1, 2, and 5, all in the blue band, providing the bulk of the PAR — as the product name suggested. The other five channels contribute marginally. The first three channels sum to 70% of PAR with 62% of the power draw, while the remaining five consume 38% and deliver only 30% of PAR.
Power Consumption
Instantaneous power readings were made possible by the handy RCE PM600, which can also measure the power factor Cos(φ) (or phase angle). The result is given directly in watts.
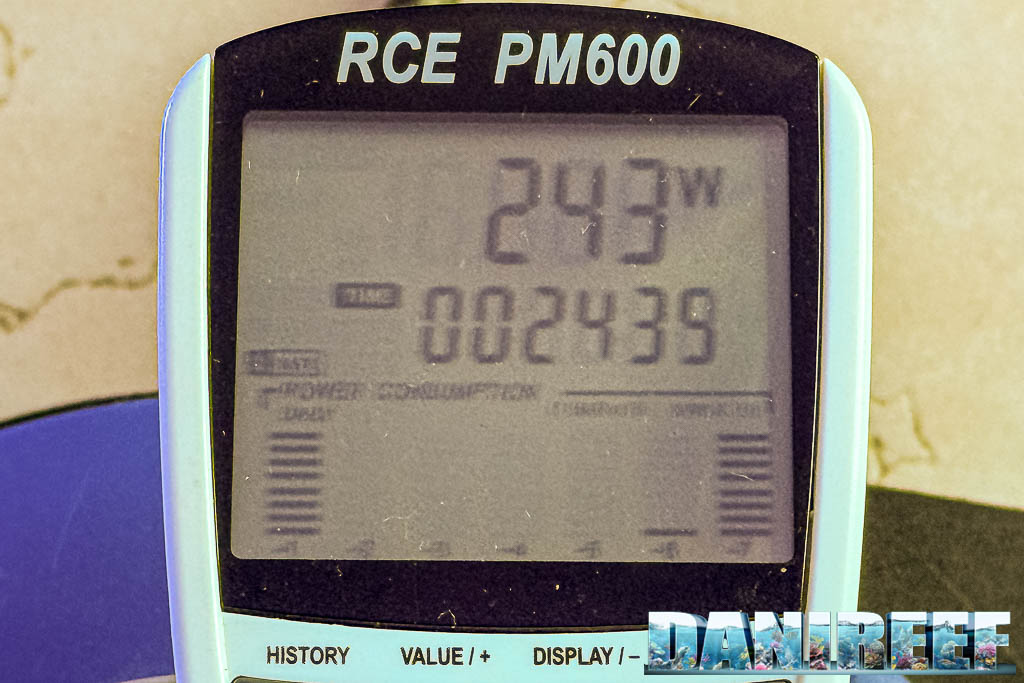
Above you can see the peak power; below is the power factor reading.
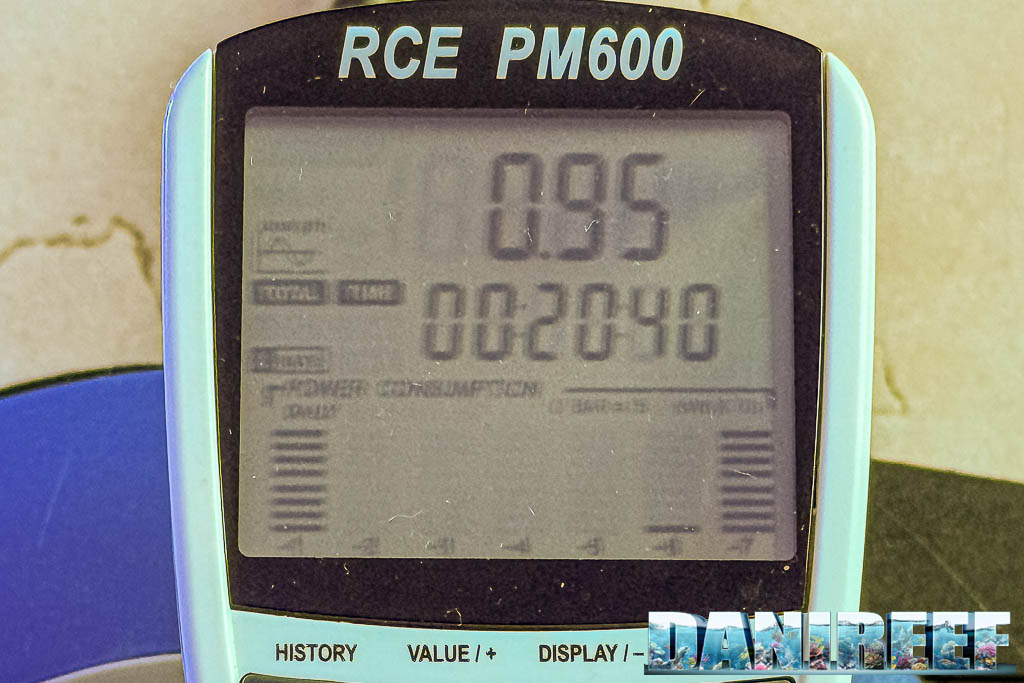
The A8 Pro II Blue therefore draws 243 watts, a value close to the claimed spec. Considering that at 17 cm the fixture delivers 2161 μmol m-2 s-1 at the center, its peak efficiency is 8.89 μmol m-2 s-1 W-1 (PAR per watt) — rather low; not because PAR is low (it’s high), but because power consumption is very high. For comparison, the Radion achieves roughly the same PAR while using about 50 watts less. So to get the same PAR, the A8 Pro II Blue uses 33% more power. Compared to the Orphek Natura, it even produces fewer PAR while the Natura consumes 100 watts less (150 W for Natura, with higher PAR than the A8 Pro II Blue at 250 W).
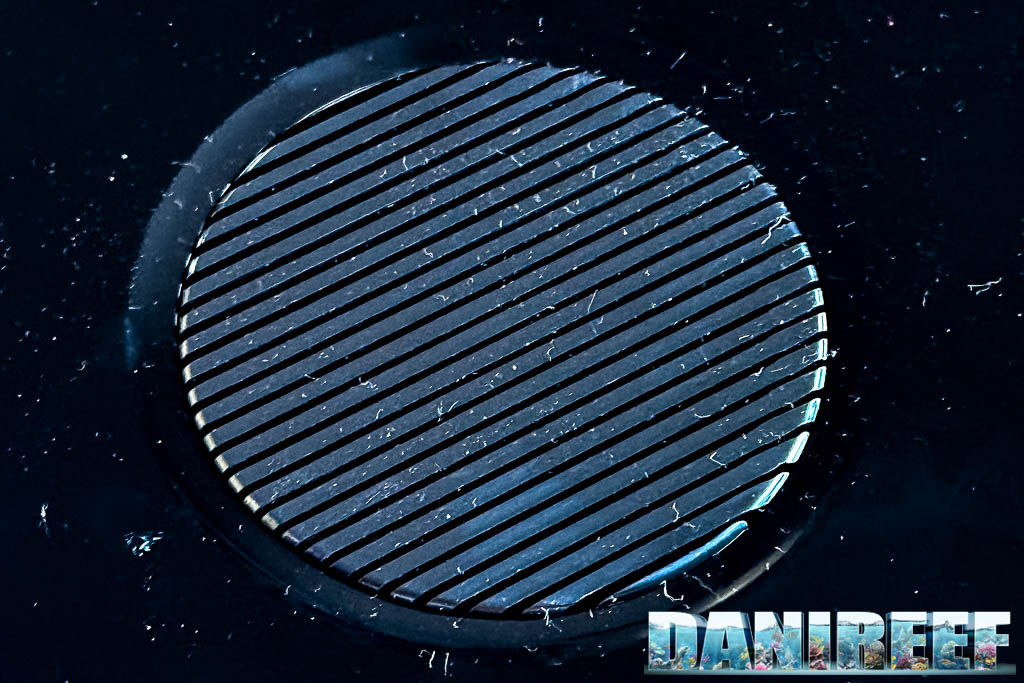
A8 Pro Blue II and heat
The A8 Pro II Blue uses active cooling, with a fan controlled by a sensor on the PCB.
Continue to page three for running costs, comparisons with other fixtures, and our final comments.
Scopri di più da DaniReef - Portale dedicato a Acquario Marino e Dolce
Abbonati per ricevere gli ultimi articoli inviati alla tua e-mail.

 presentano il futuro al CIPS 2025")


