


The DaniReef LAB workflow for PAR measurement
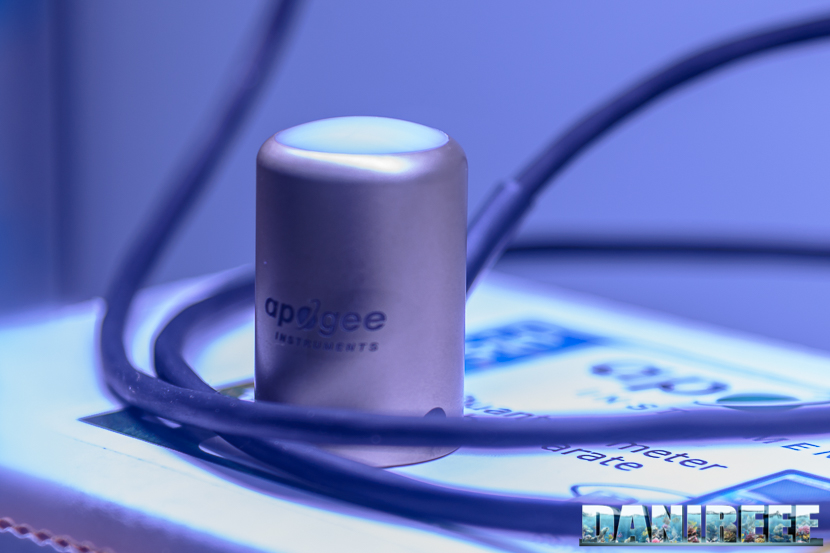
During many late-night discussions on our forum (here) we kept asking ourselves how to compare PAR values across different light fixtures. Today we use the Apogee Quantum Meter MQ-510 and the ITC Reefculture PARwise PRO to do just that.
The Quantum Meter MQ-510 measures PAR, expressed as PPFD, i.e., photosynthetic photon flux density in μmol m⁻² s⁻¹. This instrument is calibrated for underwater use; when used in air the reading must be divided by 1.32, the immersion factor. Since there is no water during the tests you’ll see below, we apply this conversion. The values you see are always corrected.

We built a 70×70 cm board and marked 17 reference points where we place the MQ-510 sensor. To mount the light we created risers at 20, 40, and 60 cm so that readings are always taken at the same distance from the sensor. This lets us create spatial curves that can be compared with other fixtures at the same distances. Note that this distance is measured from the sensor base to the base of the fixture. In practice, the distance must be decreased by 3.5 cm (the height of the measuring cylinder) and increased by 0.5 cm (the thickness of the spacers that lift the fixture).
In total, the three measurements are therefore taken at 17, 37, and 57 cm from the light, in air, with the proper correction factor applied.
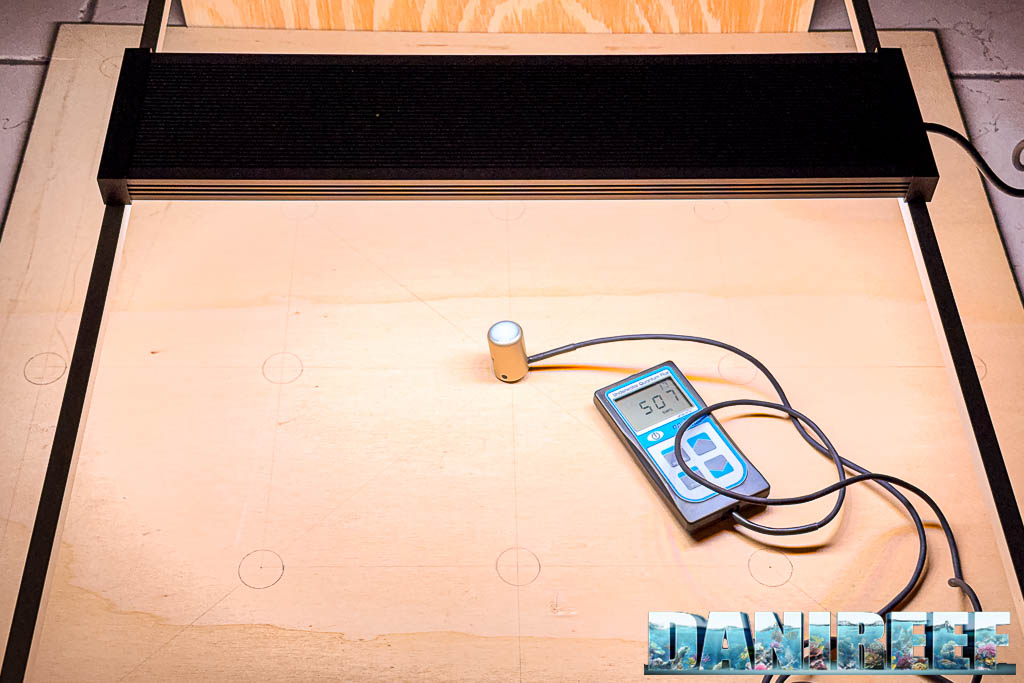
Above you can see our measurement board with spacers that keep the LED bar raised 17 cm between the board and the fixture. This ensures consistent values for any fixture we test and makes comparisons easier.
Alongside this setup, we also use the new ITC PARwise PRO, which reads PAR, generates spectrum analysis, and—most importantly—measures the Yield Photon Flux or YPF. Yield Photon Flux (YPF) is designed to quantify how effective light truly is at supporting photosynthesis and thus plant growth.
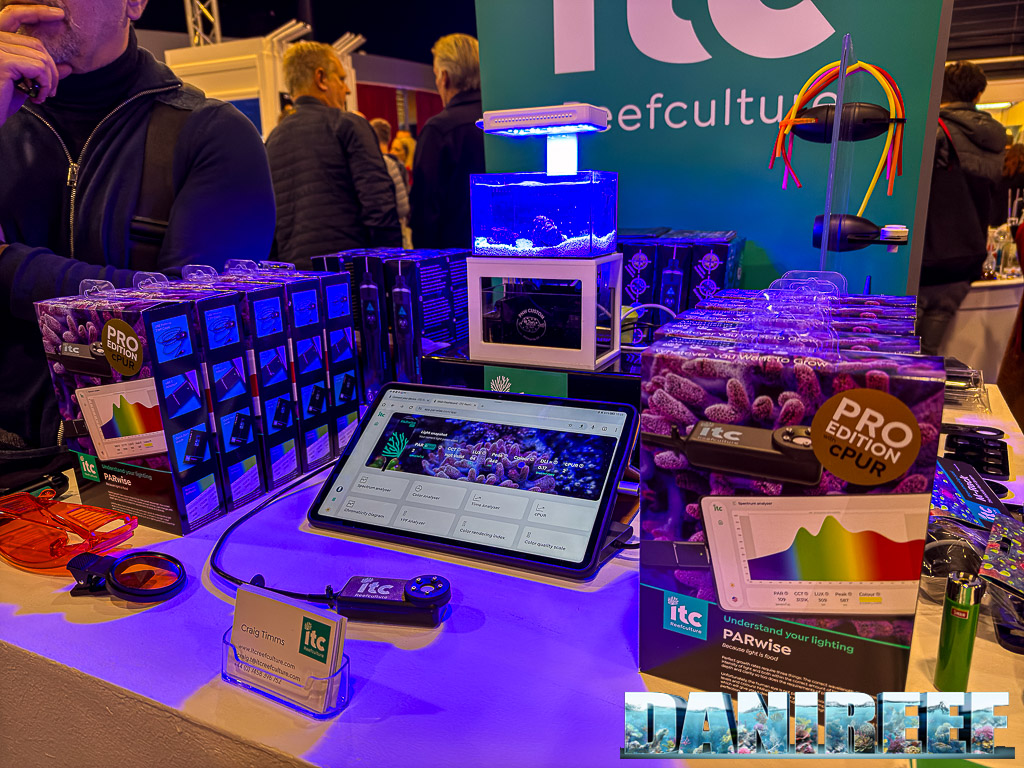
Unlike PAR, which treats all photons equally, YPF weights photons by their actual usefulness relative to the photosynthetic absorption curve. In other words, not all wavelengths are equal: some are far more productive for photosynthesis. This metric is especially useful to understand which spectra contribute most to biomass production, helping to optimize lighting systems and make better use of available energy.
In short: while PAR tells us how much light arrives, YPF tells us how much of that light plants can actually use.
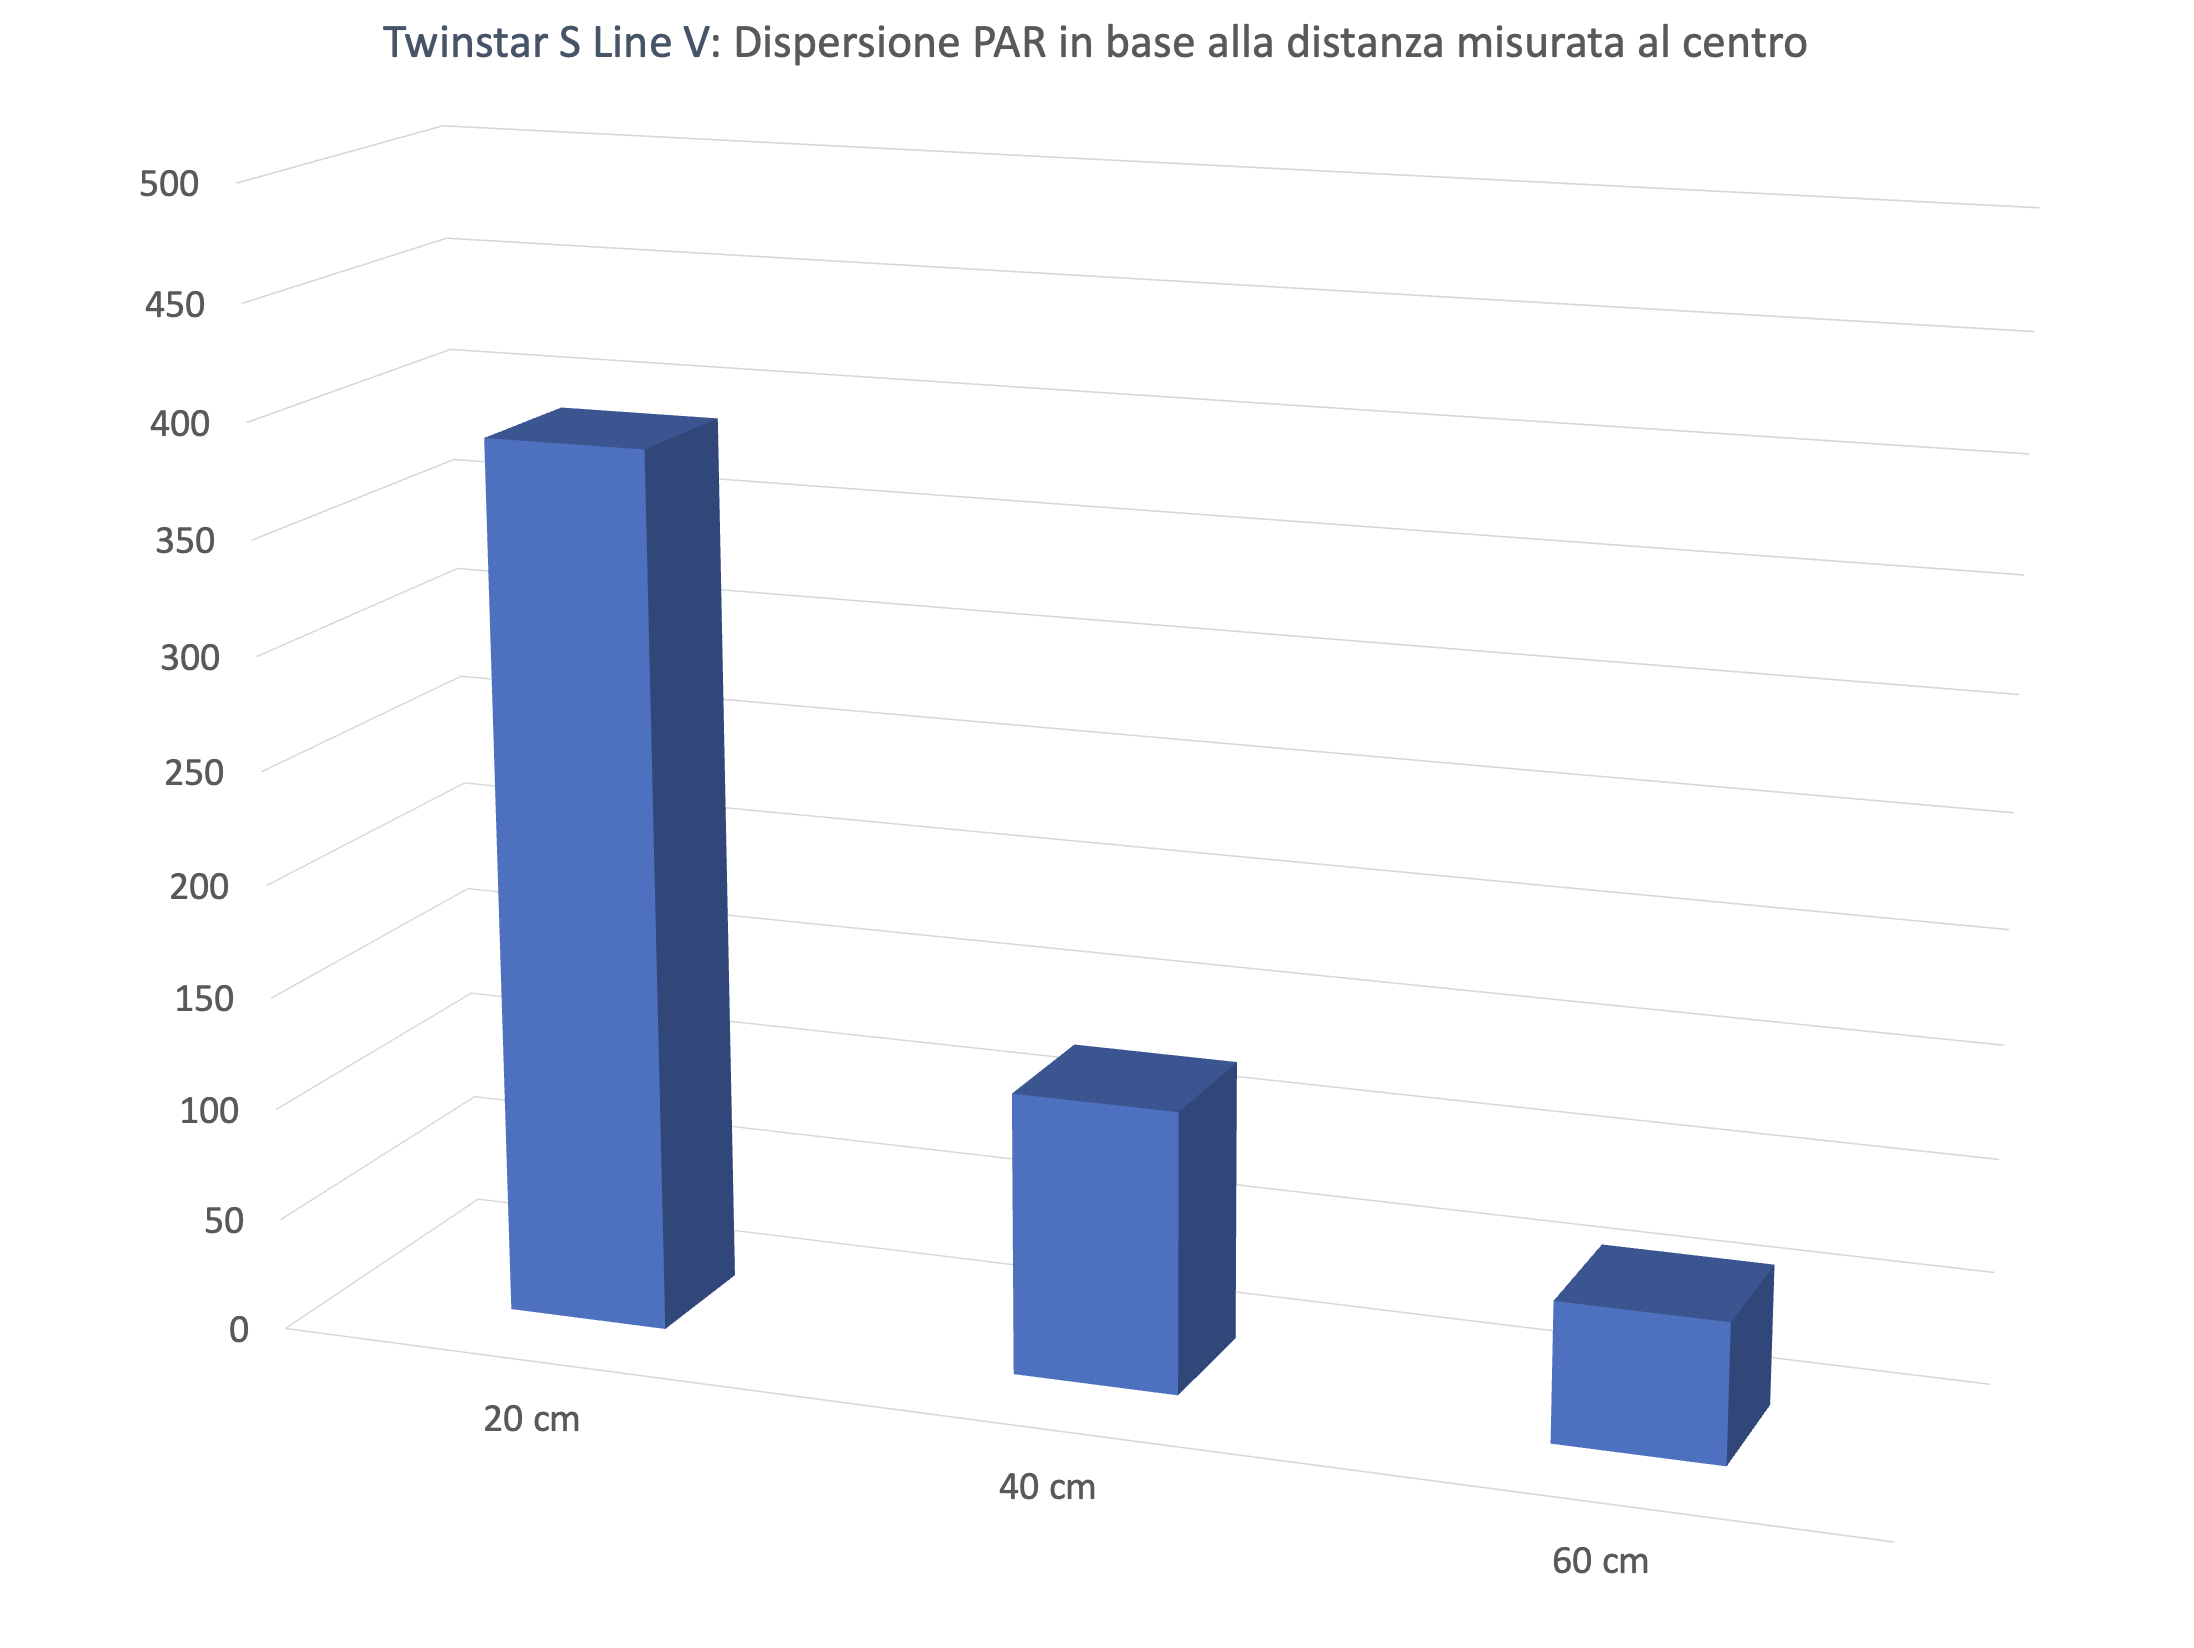
PAR measurements at 17, 37, and 57 cm
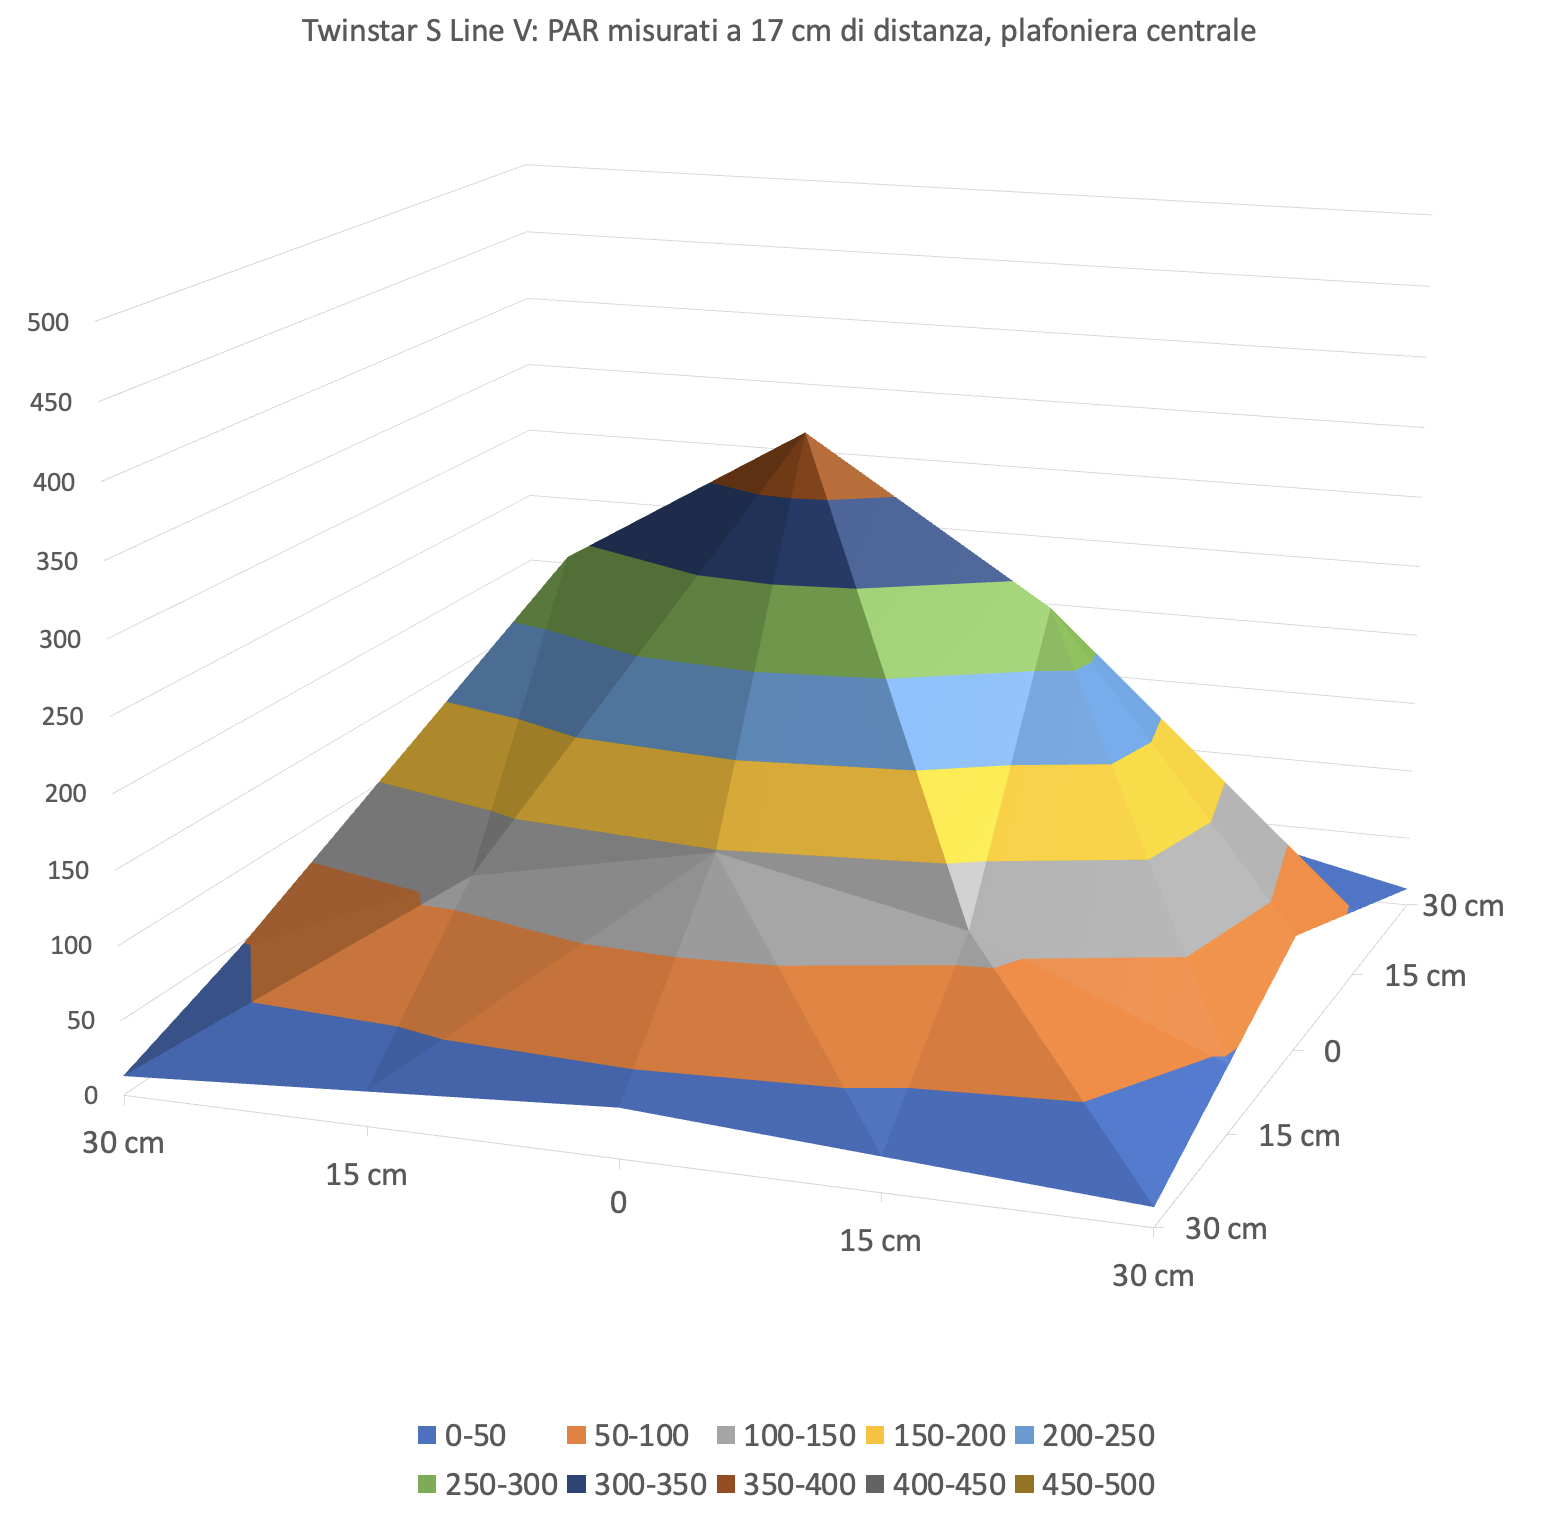
These are the analytical PAR data measured at the indicated distances, as if the entire distance were in water. Right below each table you’ll find the corresponding coverage chart, using the same scale we apply to all freshwater fixtures we’ve measured—and will measure in the future. You can find every freshwater lighting review at this link.
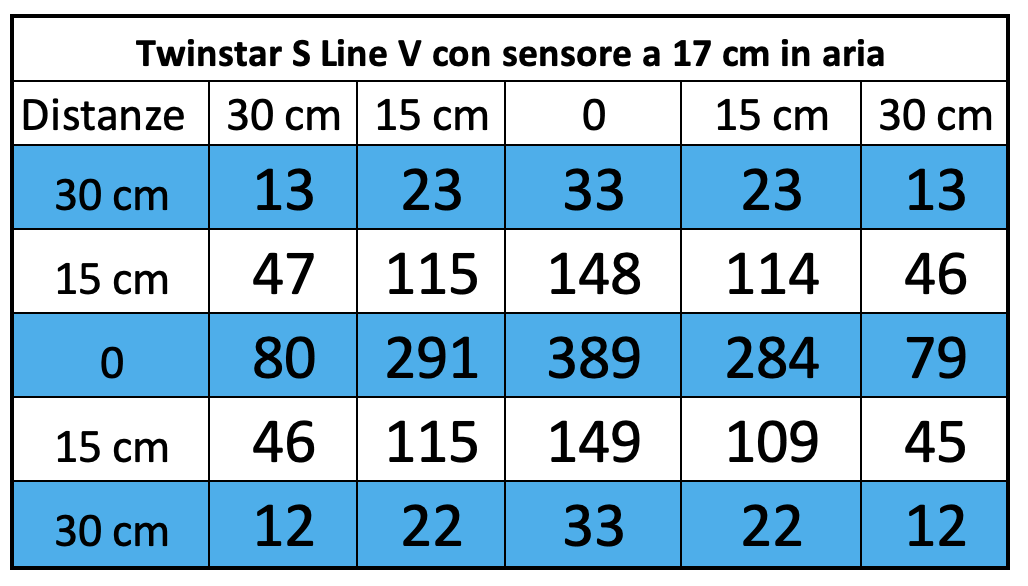
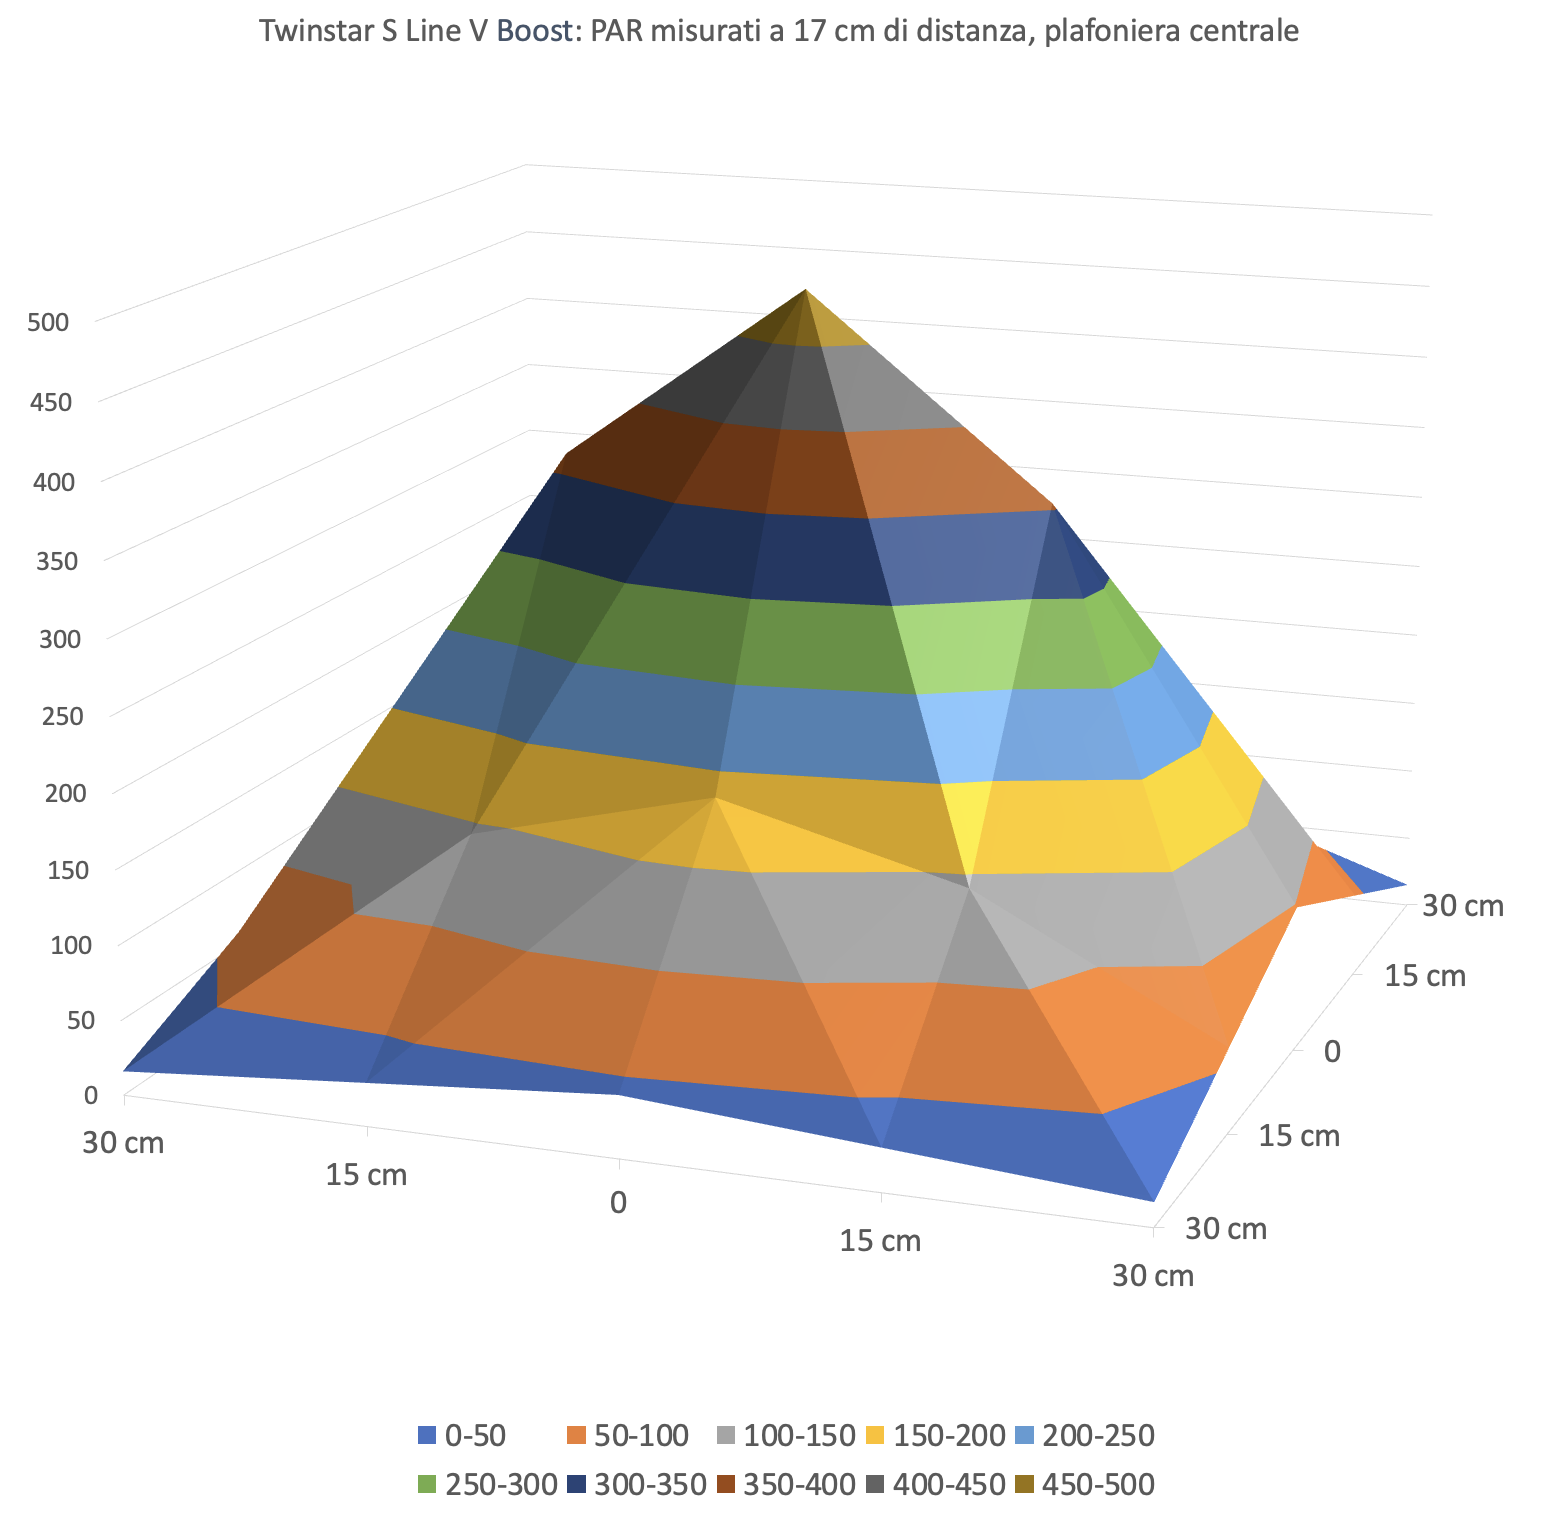
At 17 cm
PAR distribution shows the classic “dome” profile: a central peak of 389 μmol m⁻² s⁻¹ with a gradual decline toward the sides. The dome is steep (still very high at 15 cm off-center: 291–284 μmol m⁻² s⁻¹) and drops only at the extreme corners (~12–13). In practice, tons of energy under the light and solid levels in the adjacent quadrants—ideal for demanding plants placed in the foreground or midground.
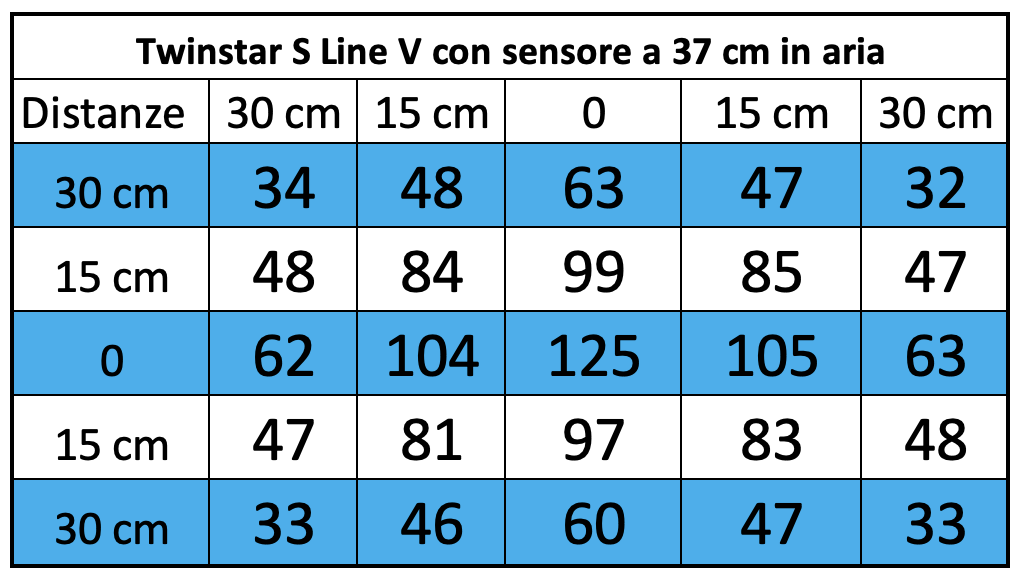
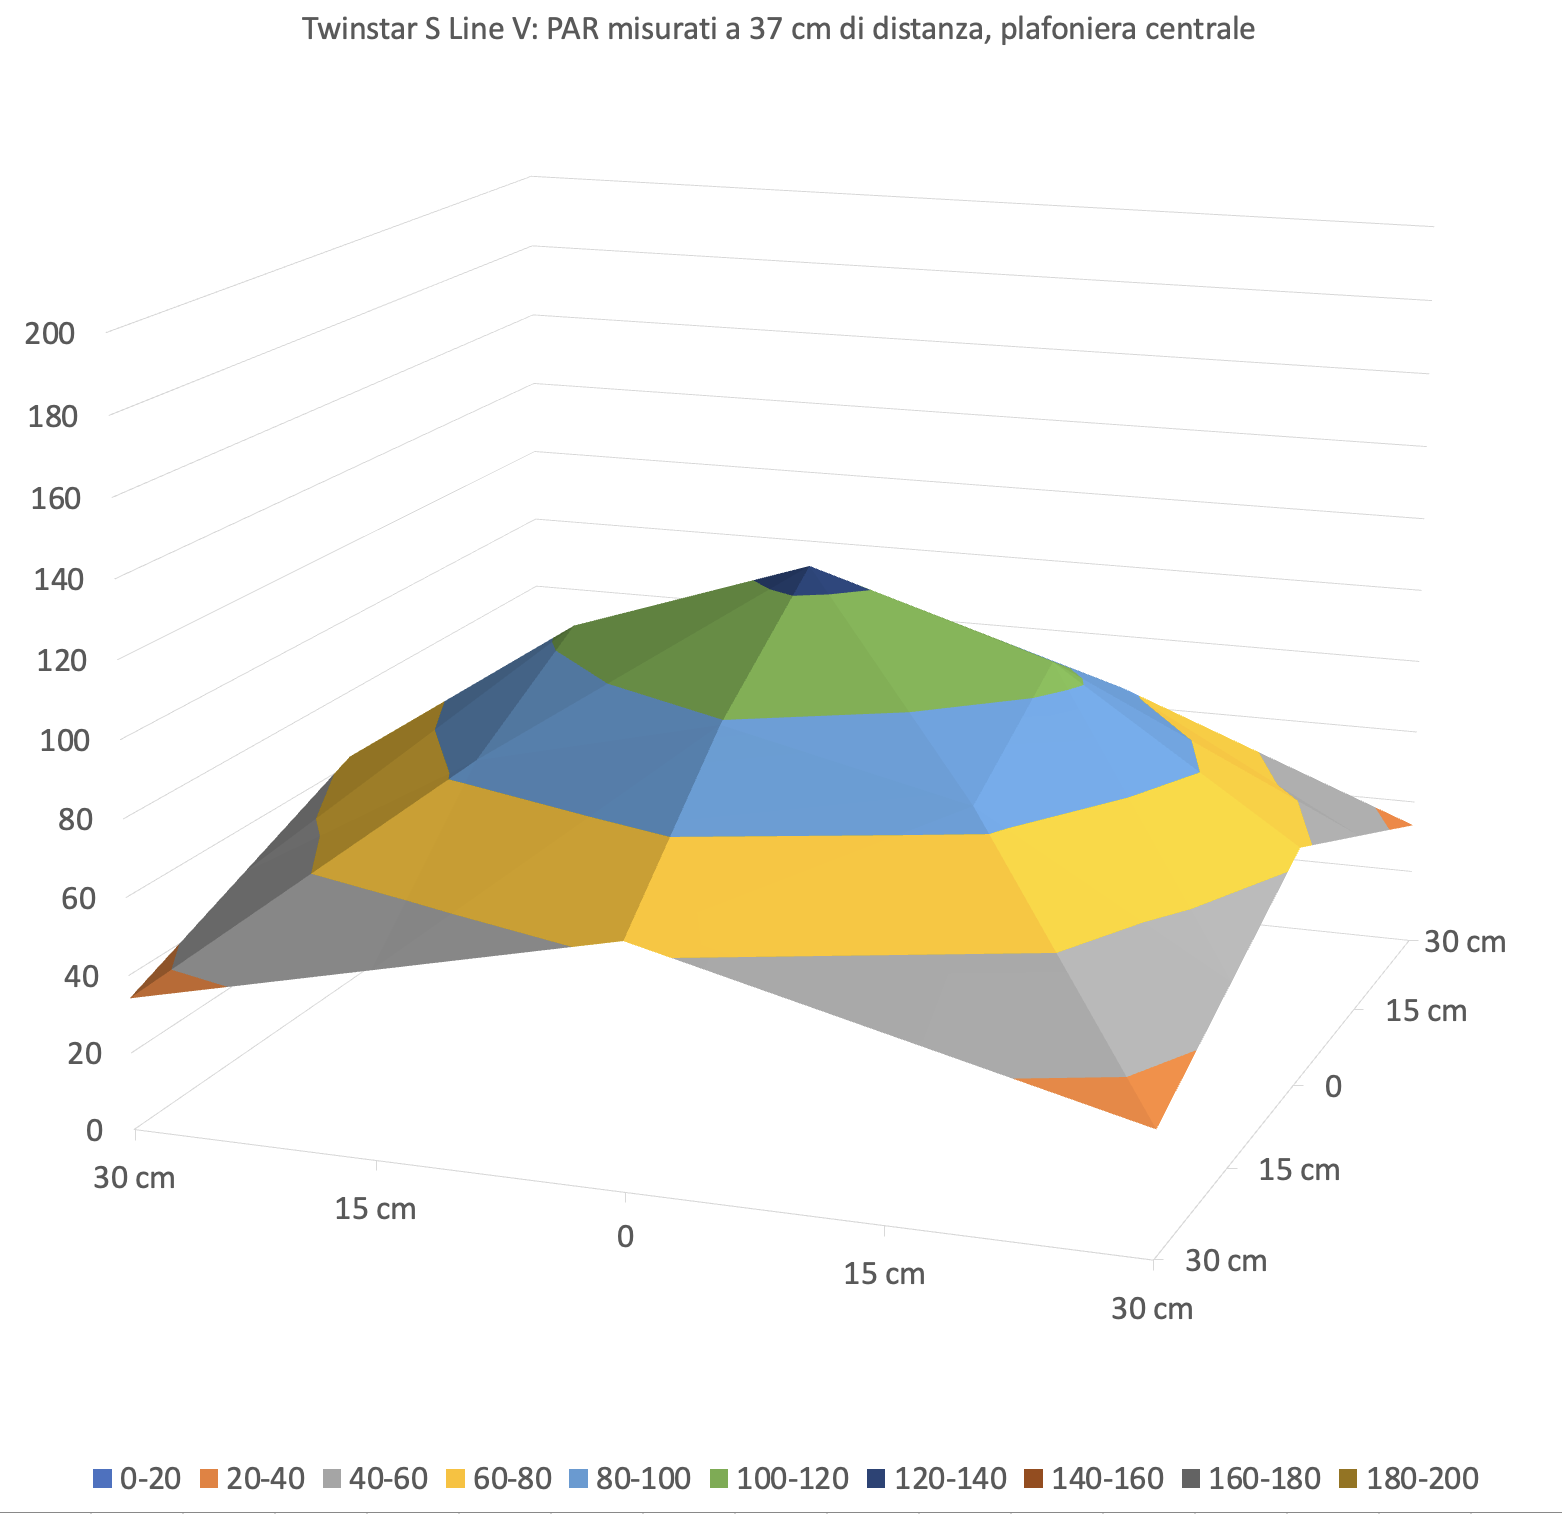
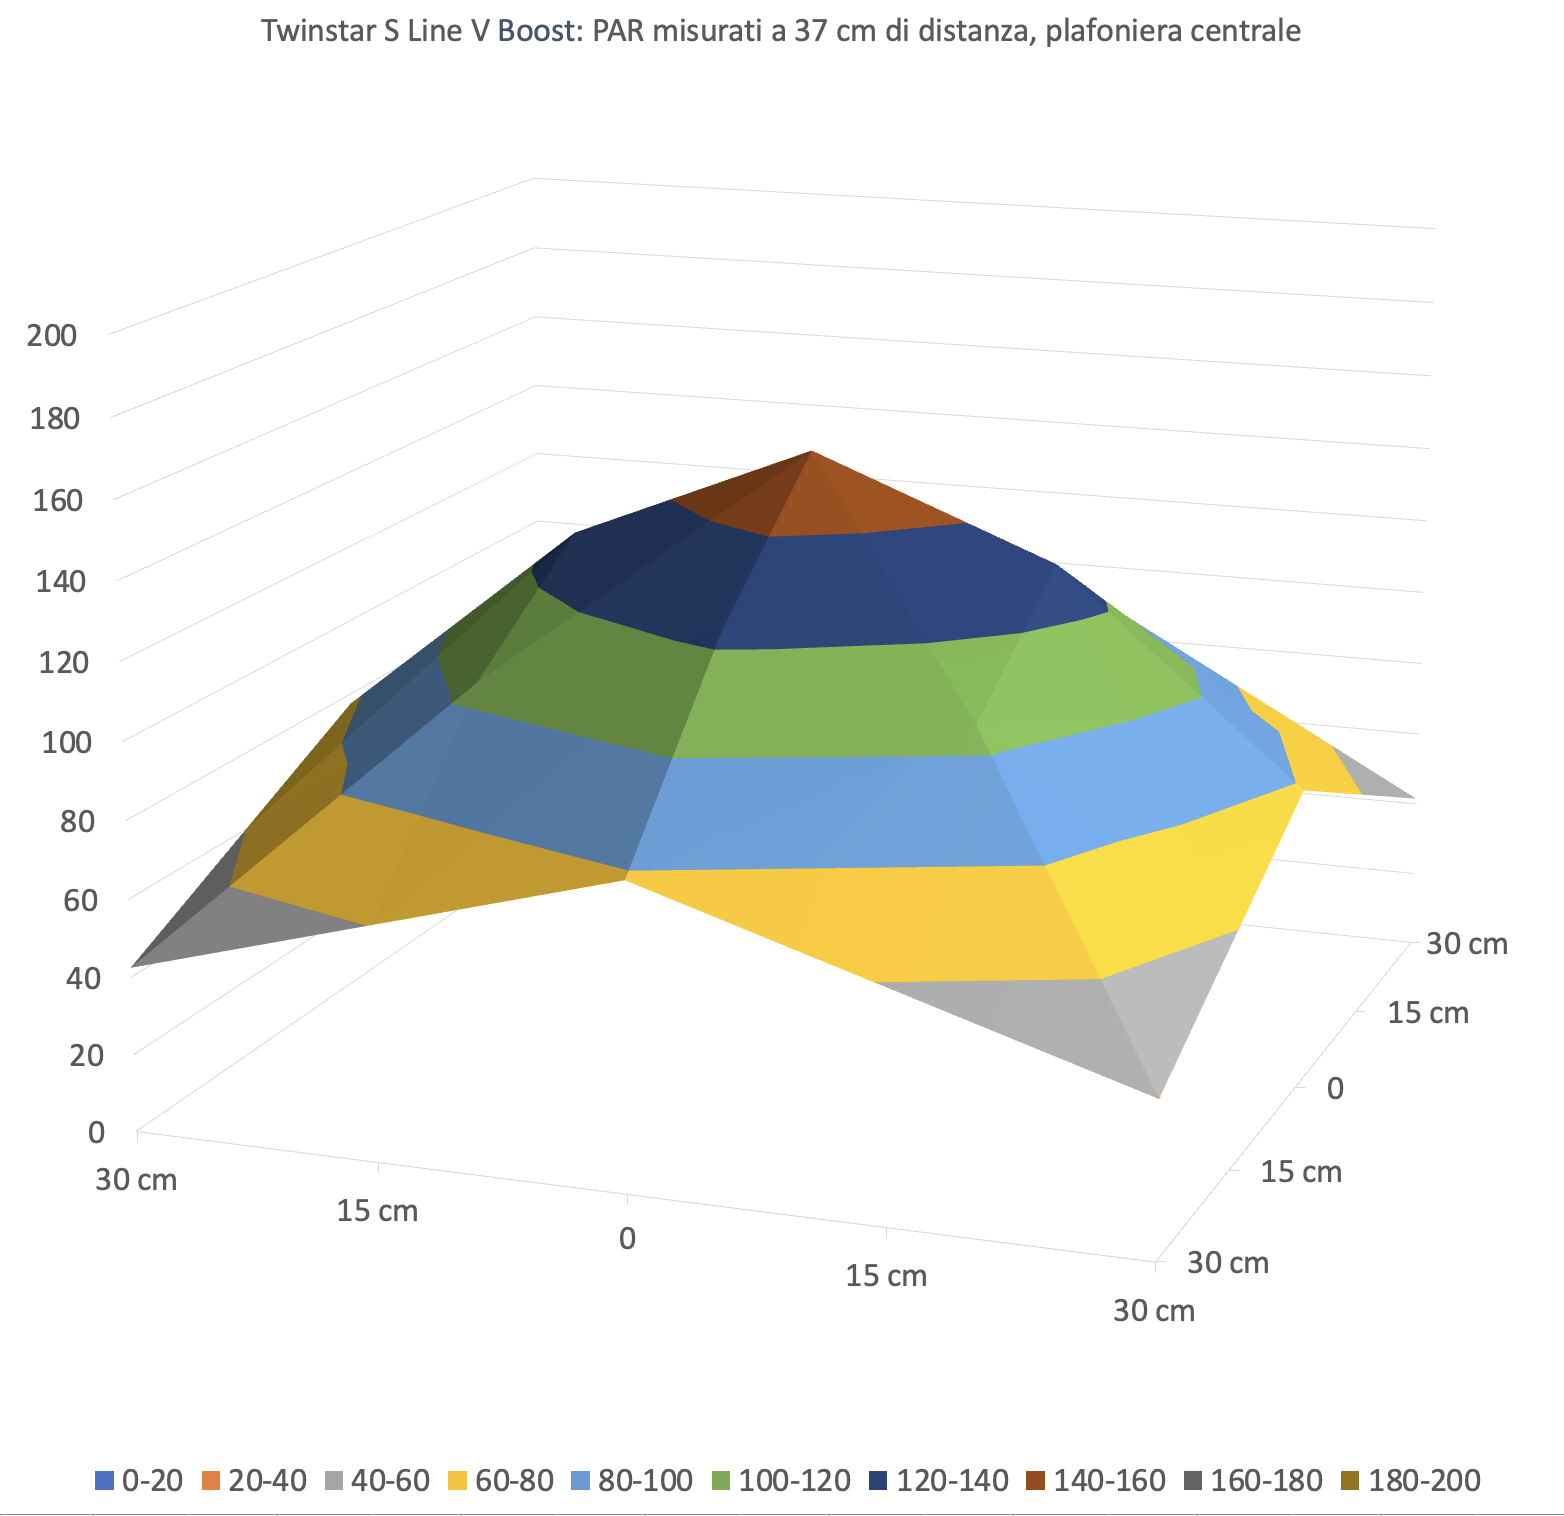
At 37 cm
As distance increases, the light spreads and evens out: the center drops to 125 μmol m⁻² s⁻¹, while values at 15 cm remain tight (~105–104). Useful width grows a lot and the center-to-edge gradient shrinks, making this height perfect for most medium–high layouts: an excellent compromise between intensity and coverage.
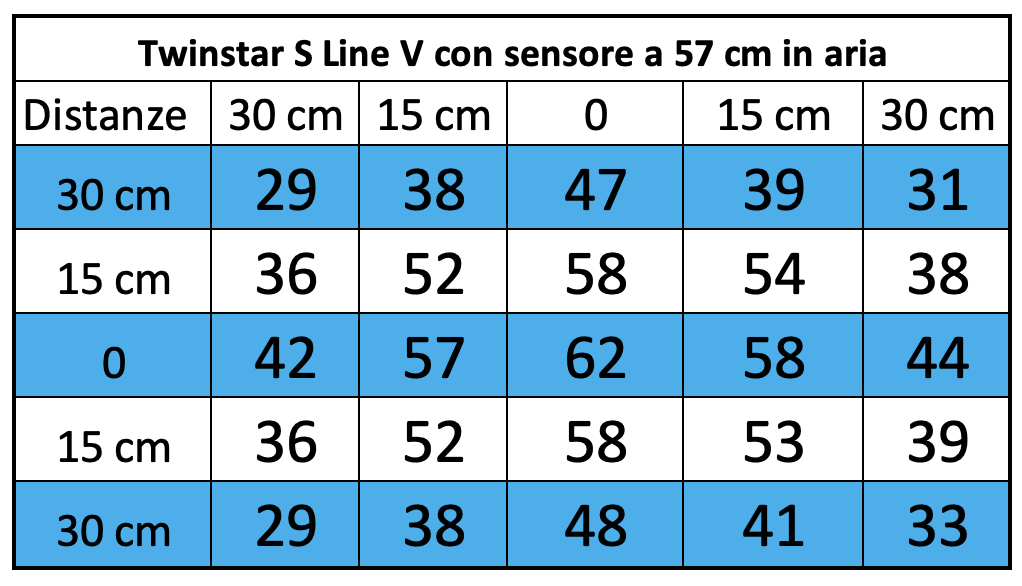
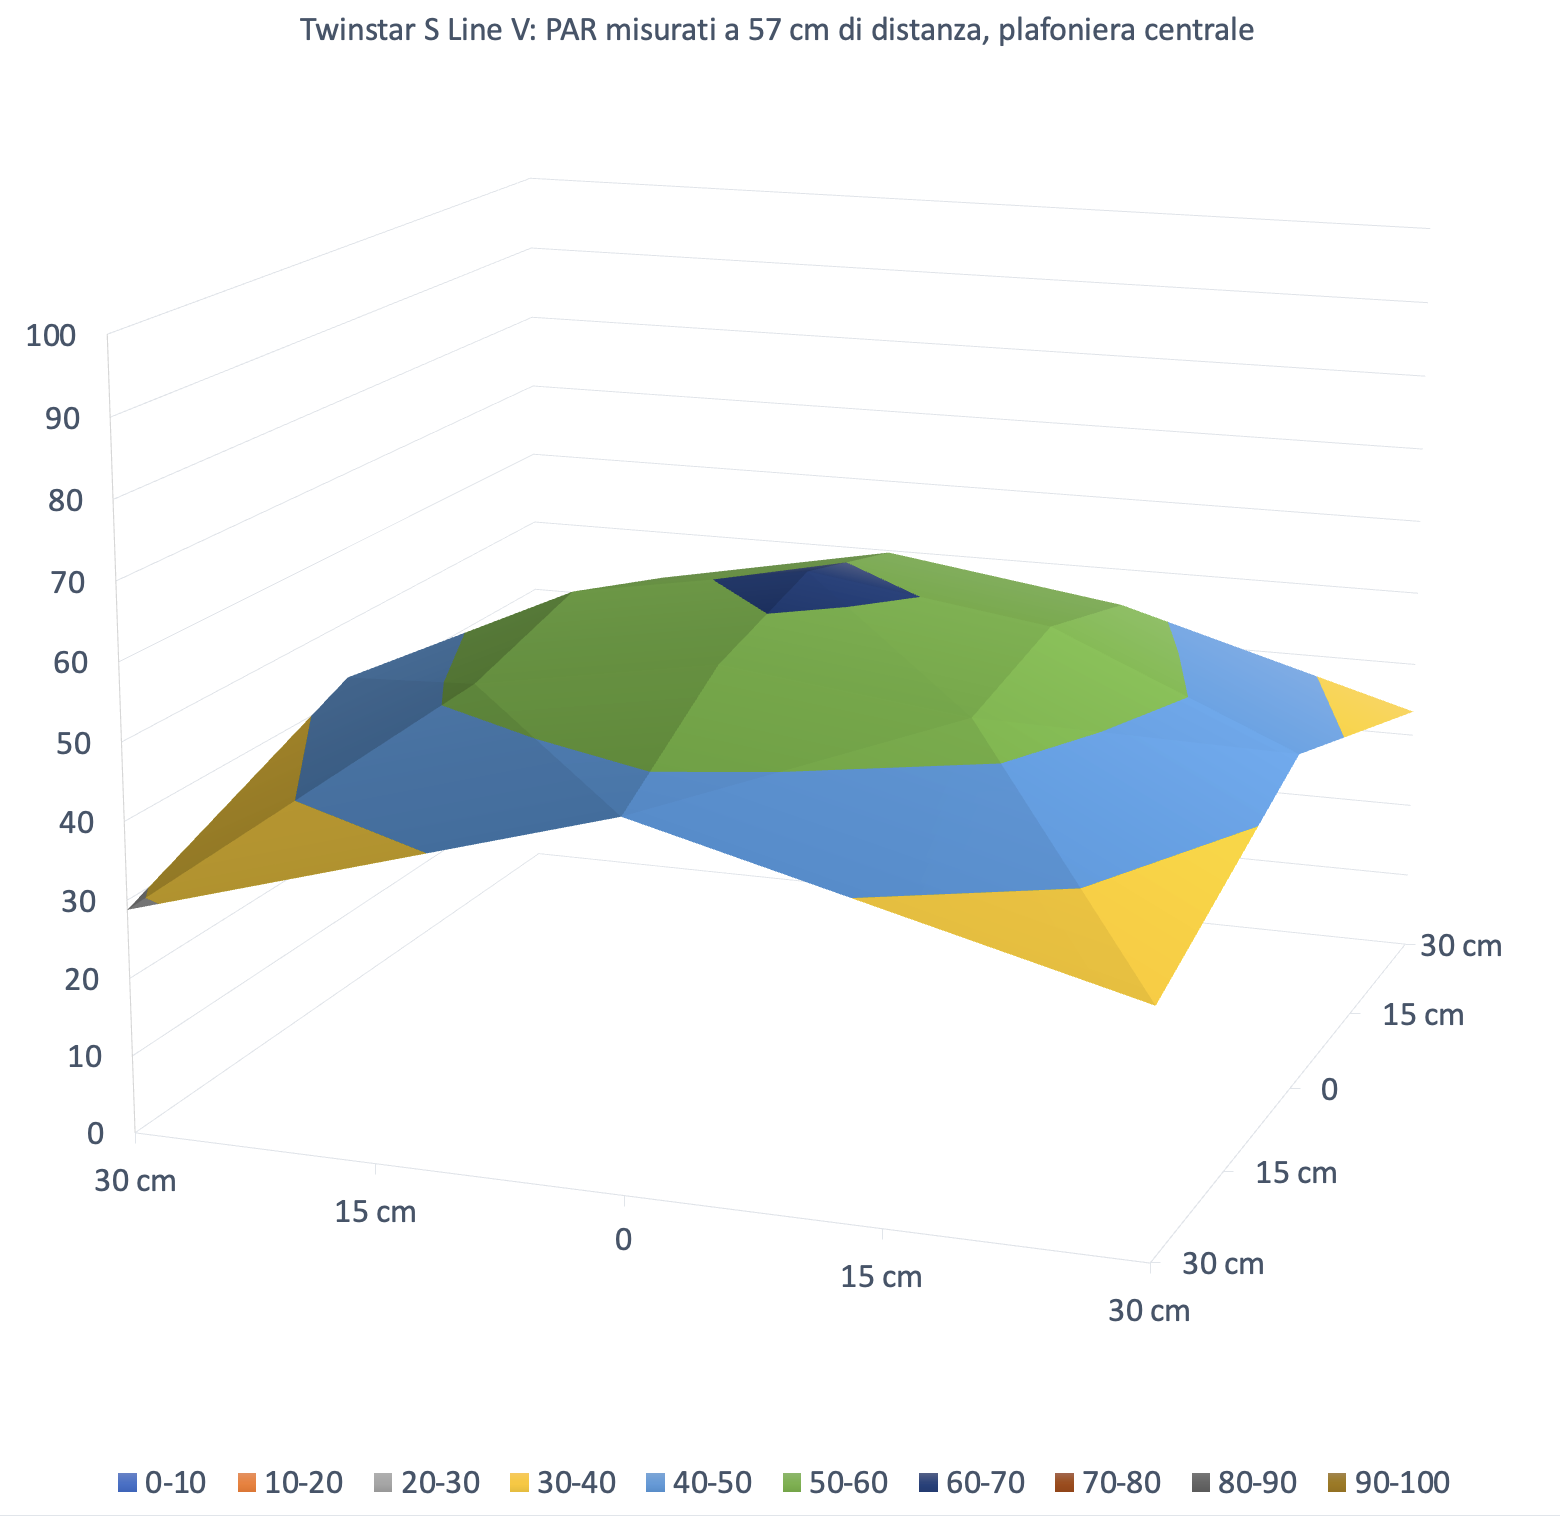
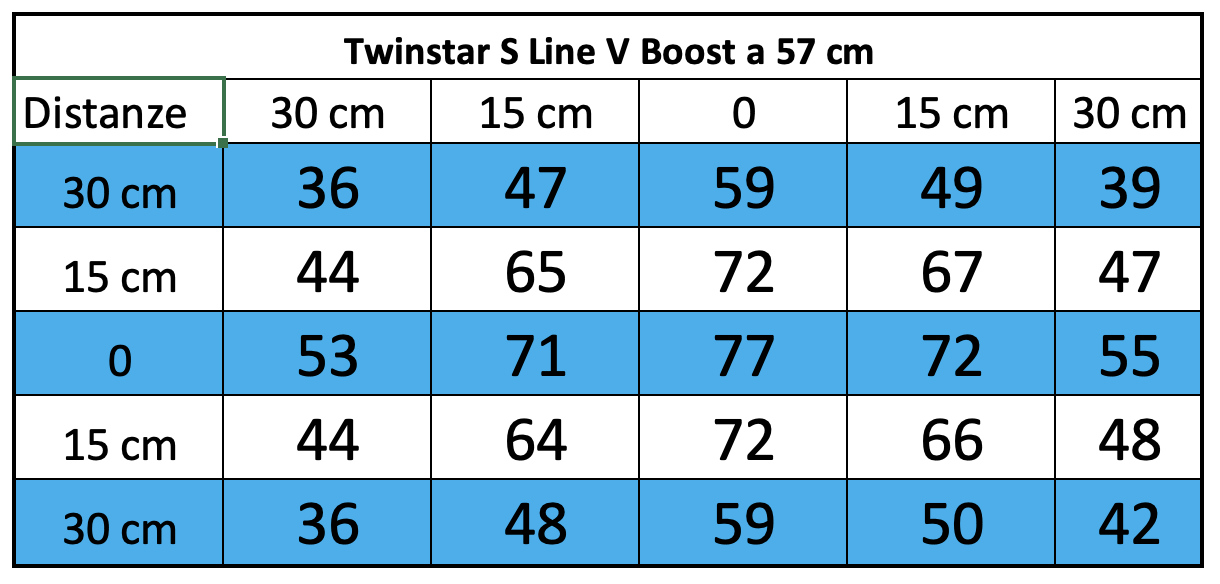
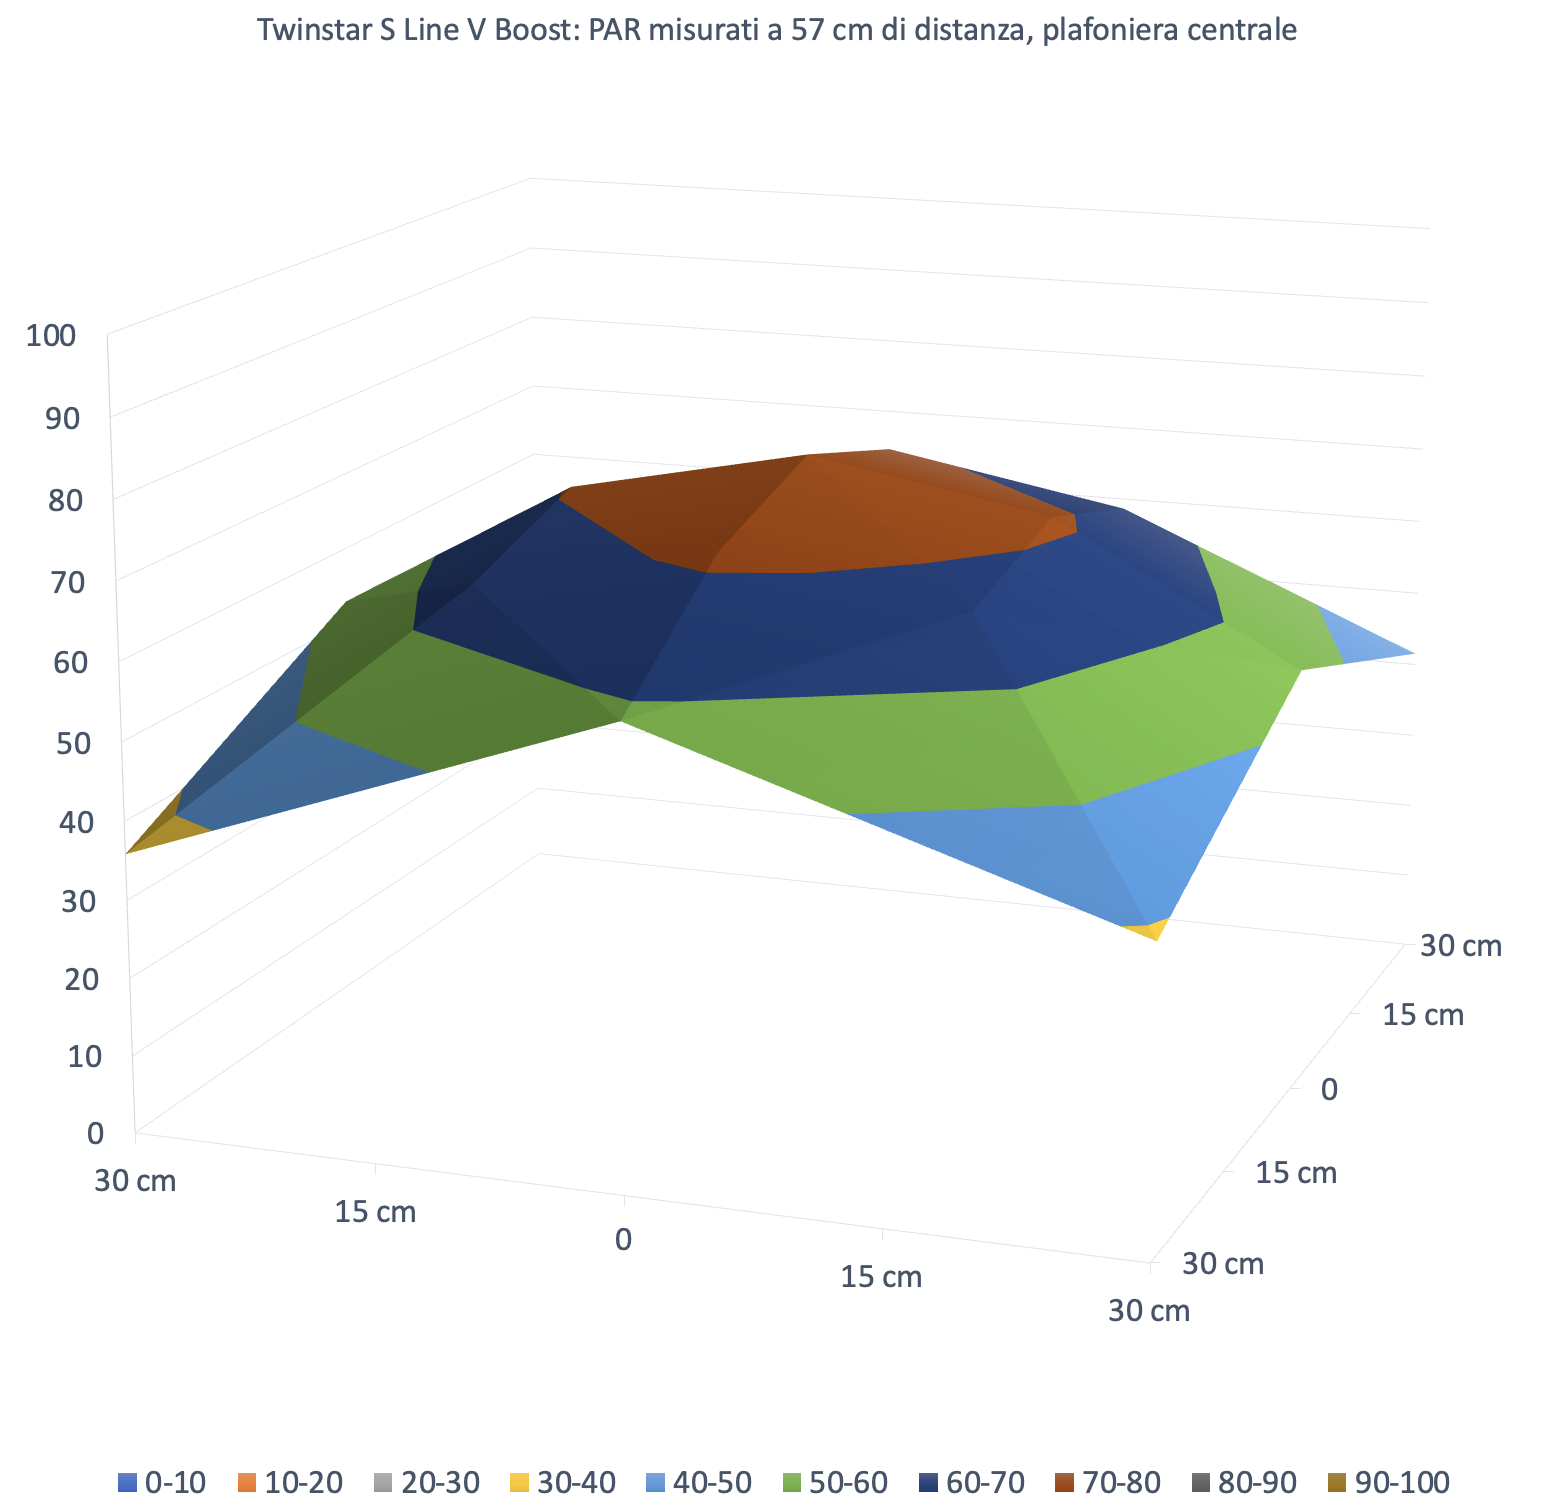
At 57 cm
Higher still, the curve flattens further: the center reads ~62 μmol m⁻² s⁻¹ and the next rings stay close (50–60). Uniformity is nearly complete, with wide, soft coverage—great for deep tanks or for diffuse light on low–medium plants, accepting the reduced peak—even at 57 cm from the light!
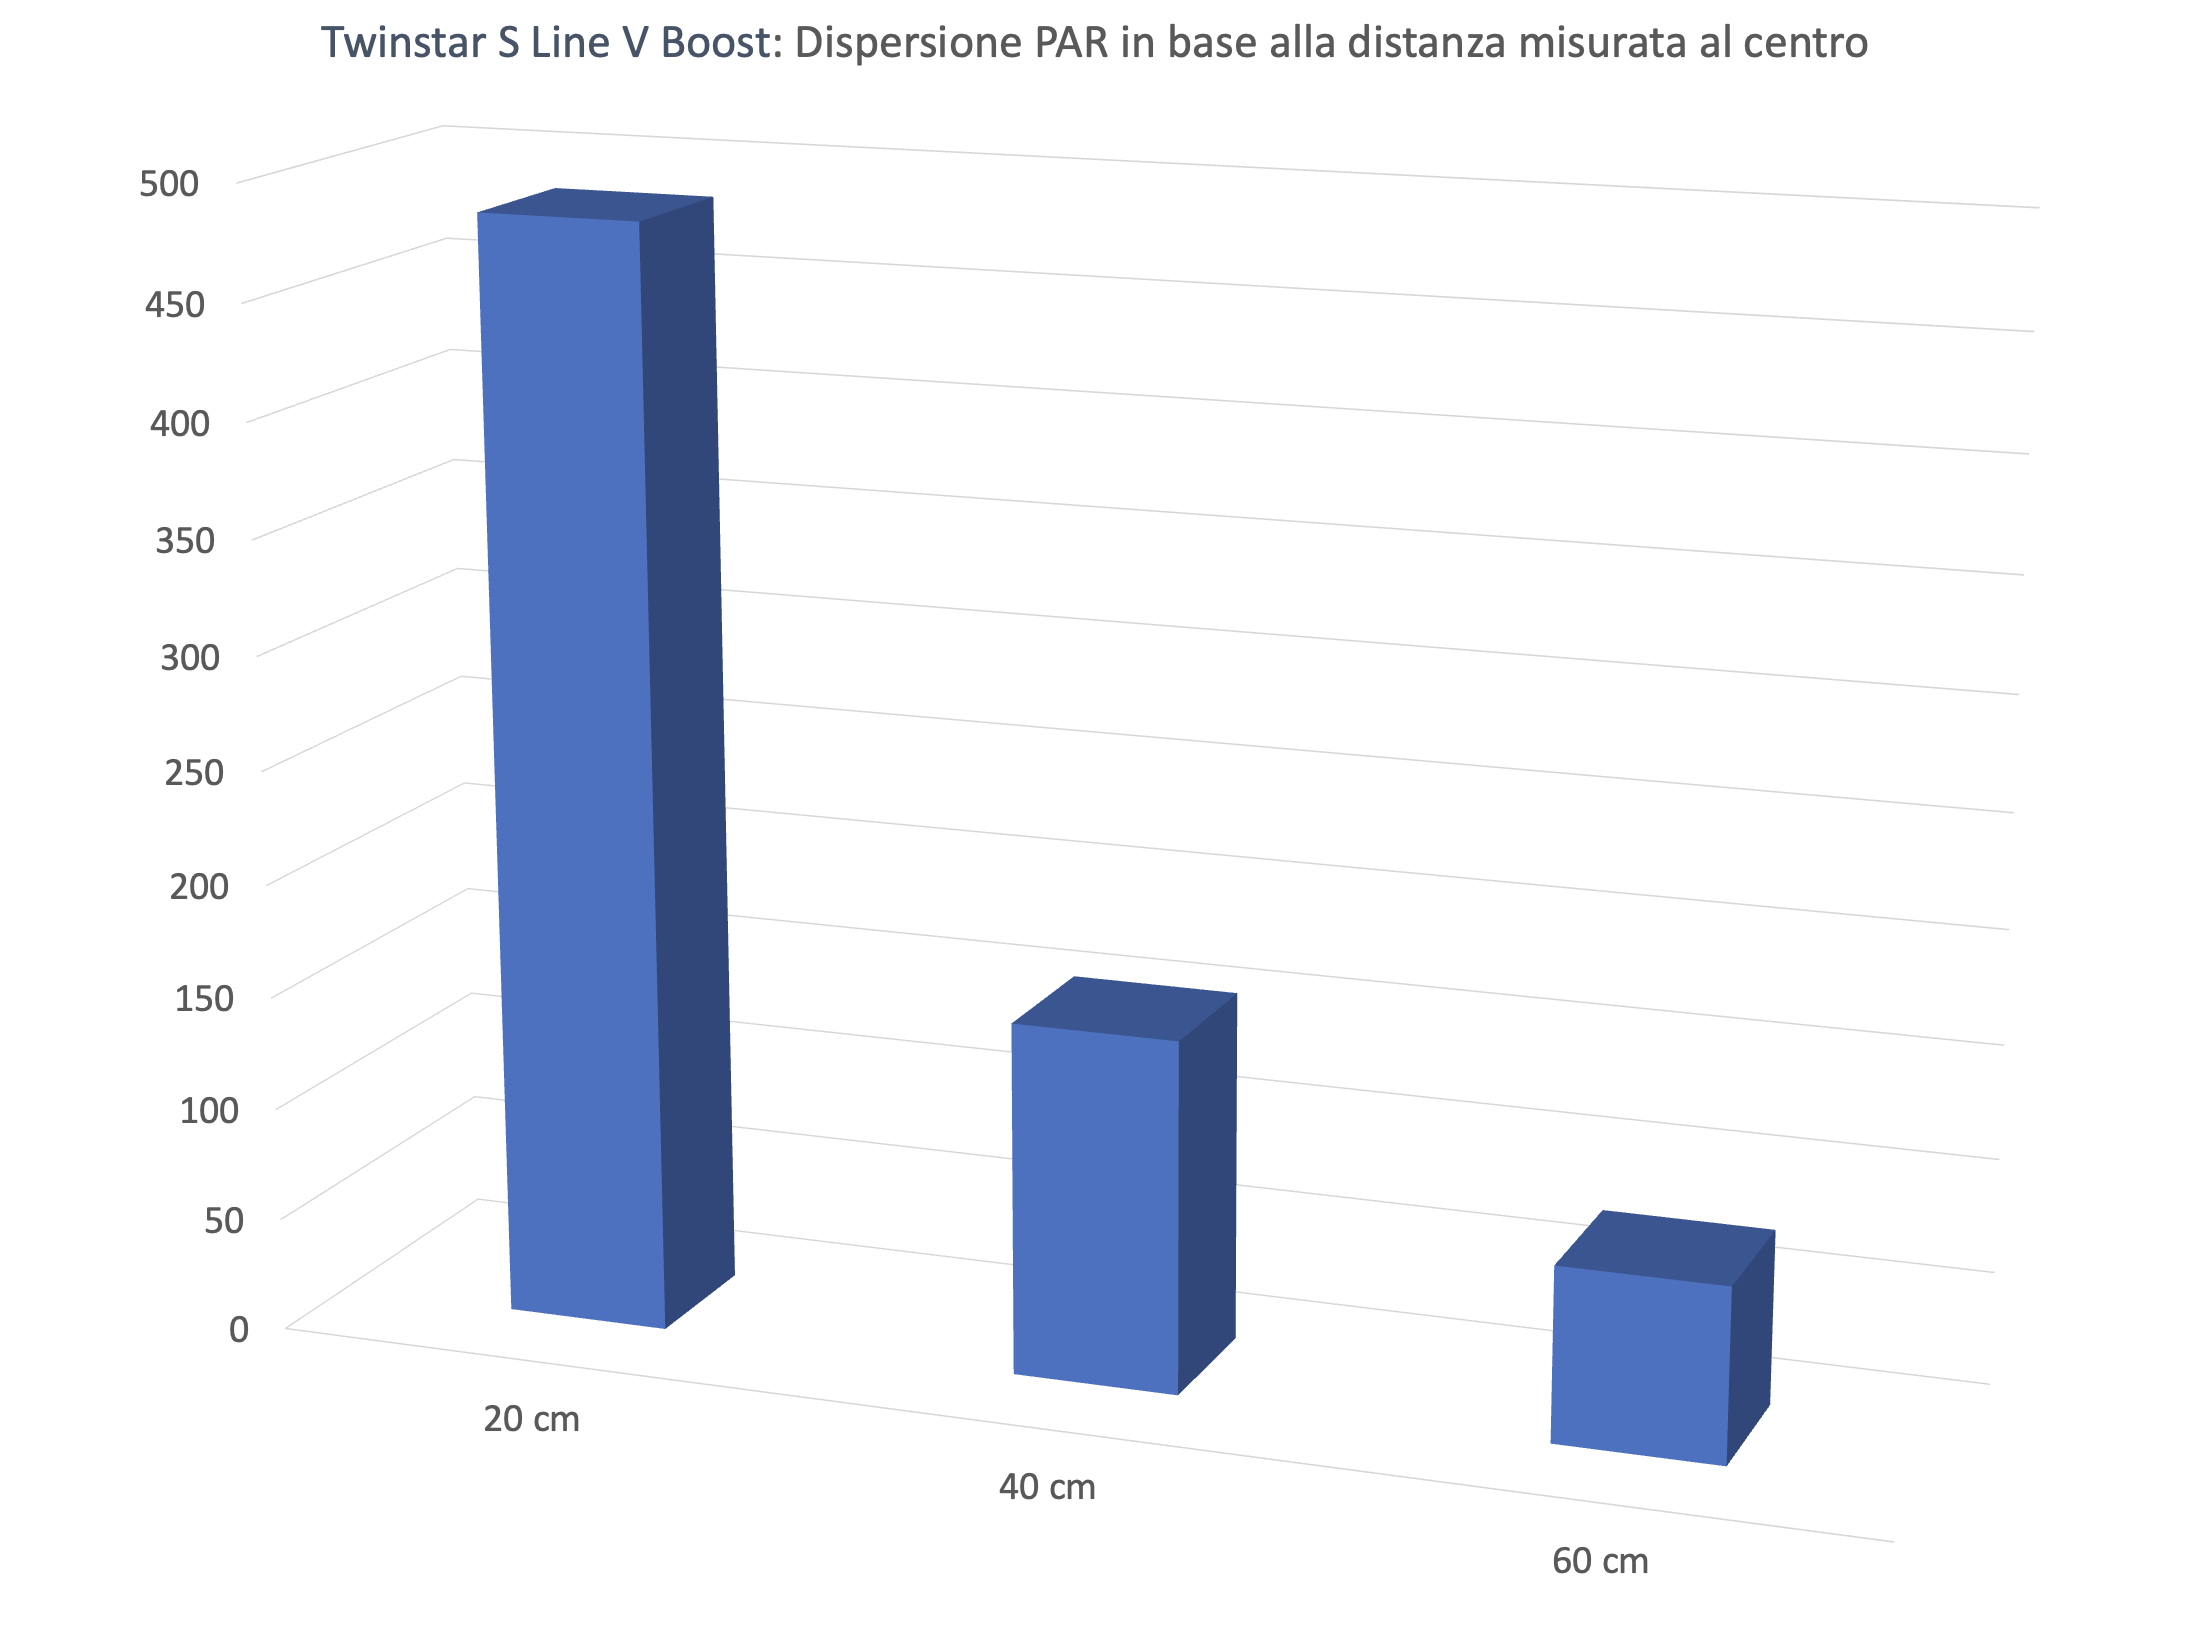
Boost Mode
The Twinstar S-Line V includes a Boost mode that automatically raises output by about 20%, with a very significant increase in PAR. We plotted the charts to the same scale as standard mode to highlight the difference: peaks are noticeably higher, so caution is advised in shallow tanks or with sensitive plants.
This function is meant to provide an extra burst of light in specific phases (e.g., to push carpet plants or to enhance coloration for short intervals). It shouldn’t be used continuously unless the layout is very demanding, because central values can become excessive.
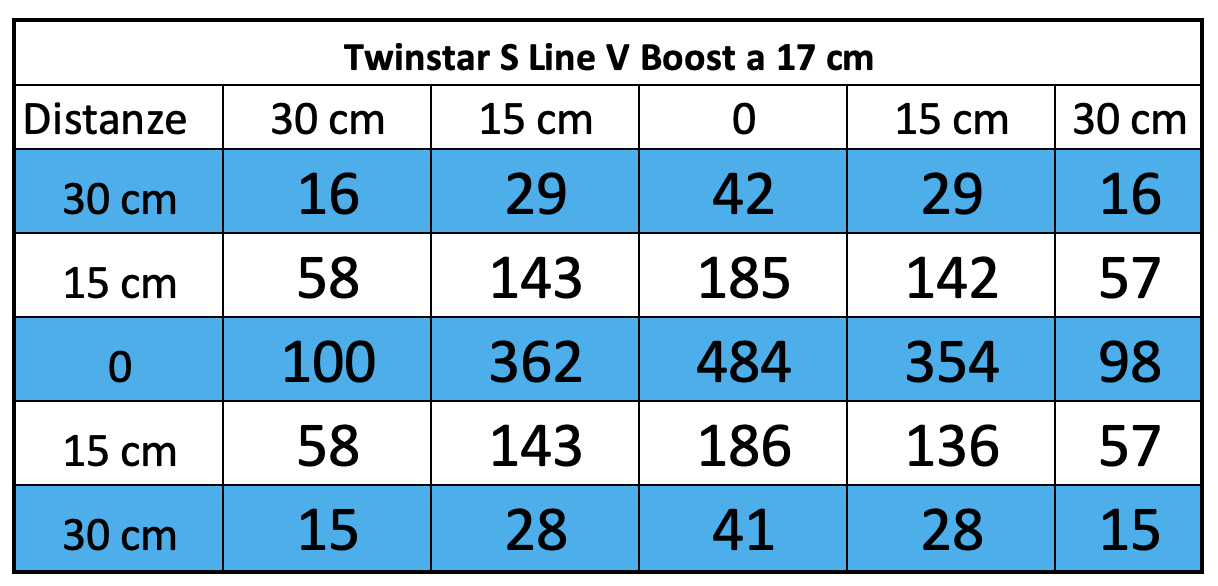
At 17 cm
In Boost Mode, the center jumps to 484 μmol m⁻² s⁻¹, with very high values still at 15 cm off-center (~354–362). These numbers exceed the needs of almost all aquatic plants and, if used for long periods, can lead to photoinhibition. Excellent, however, as an “extra push” for demanding carpet plants or for brief high-photosynthesis phases.
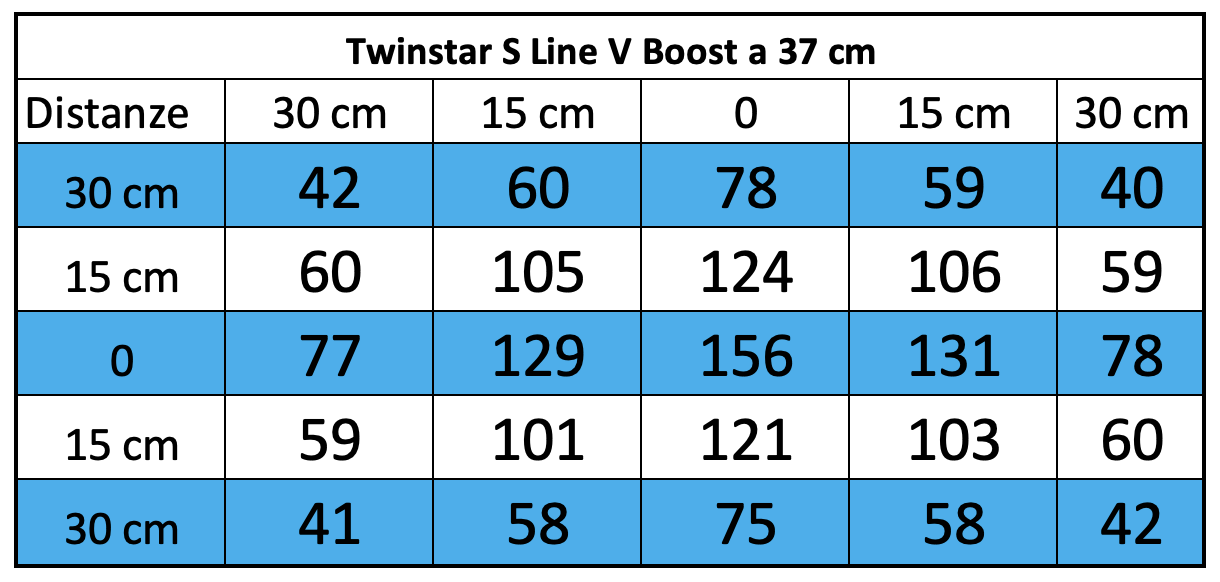
At 37 cm
The curve becomes more manageable: the center sits at 156 μmol m⁻² s⁻¹, with edges clustered around 120–130. A balanced distribution that, with Boost Mode, moves lighting firmly into the high-light zone—ideal for complex planted layouts and red plants.
At 57 cm
Even at this considerable distance, Boost Mode delivers a surprising level: 72–77 μmol m⁻² s⁻¹ at the center, with edges not far behind (50–60). Here the fixture behaves almost perfectly for deep tanks or low–medium layouts, providing uniform light with a higher central “core” that also supports moderately demanding plants.
Center PAR and Total Energy
The next two charts show how center PAR decreases as distance increases, and—more importantly—how the fixture’s total emitted energy drops.
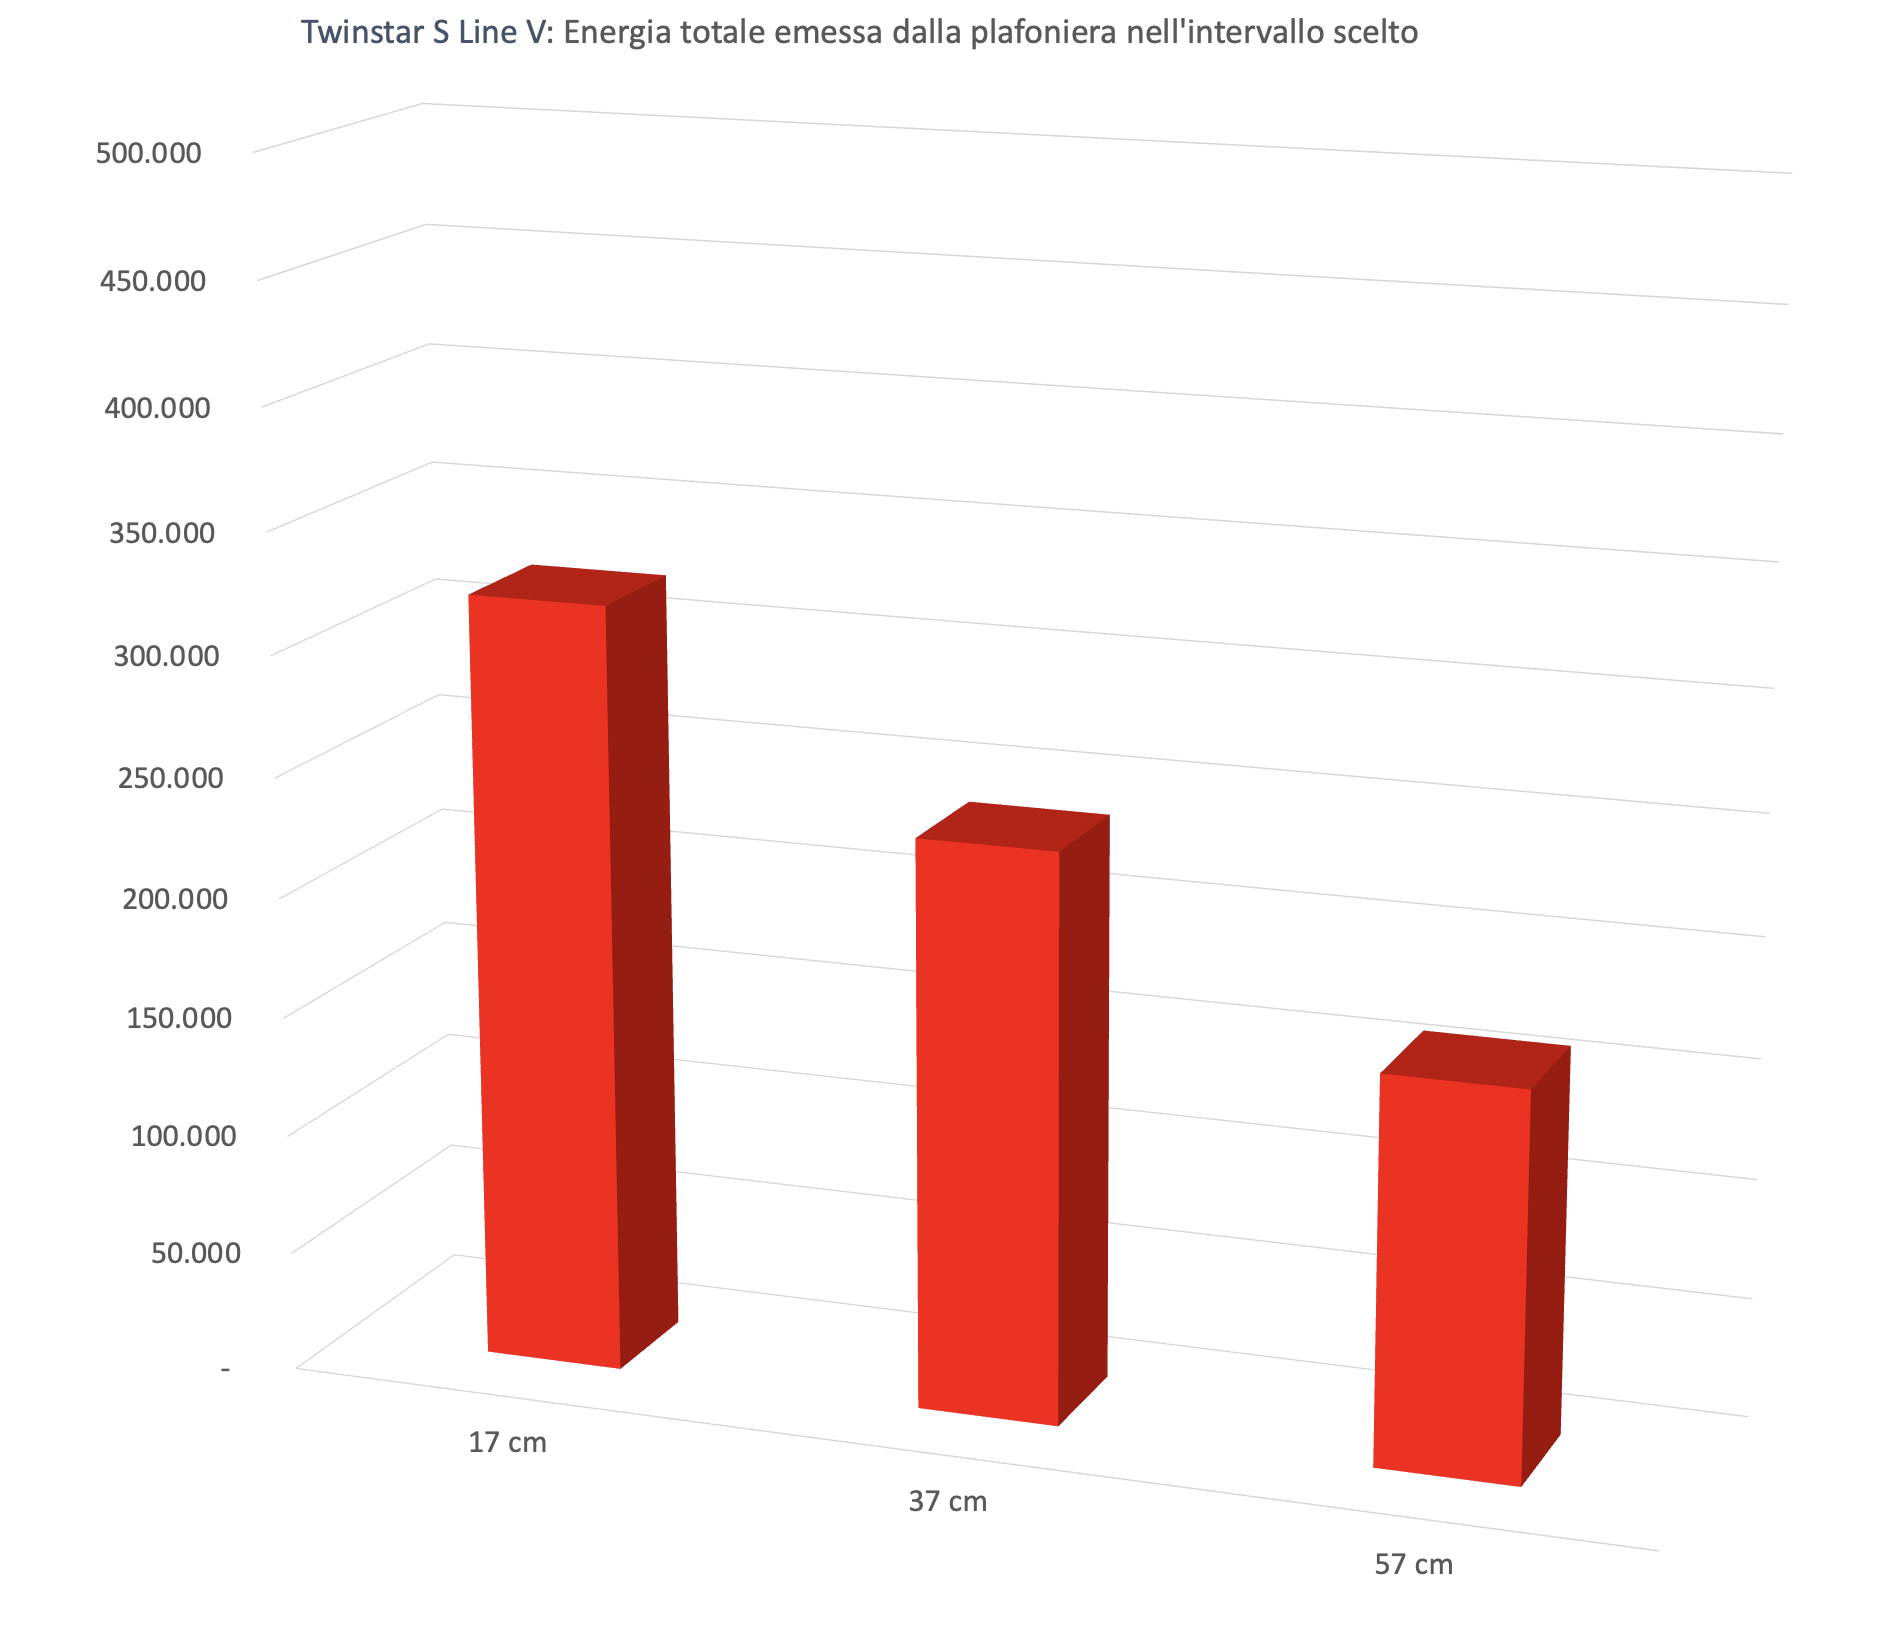
On one hand, we see that center PAR drops markedly from 17 to 37 cm and then further at 57 cm. This is typical of fixtures without tight lenses, where light spreads gradually while widening coverage. More interesting is the total energy emitted: here the reduction is much less pronounced, meaning most of the light still remains within the aquarium.
- 320,000 μmol m⁻² s⁻¹ total energy at 17 cm.
- 237,000 μmol m⁻² s⁻¹ total energy at 37 cm — 74% retained.
- 161,000 μmol m⁻² s⁻¹ total energy at 57 cm — 50% retained.
An extremely meaningful result showing that the Twinstar S-Line V ensures excellent coverage efficiency: while center PAR naturally decreases, overall energy distributes evenly, making it a strong option for growing most aquatic plants—even in medium-to-large tanks.
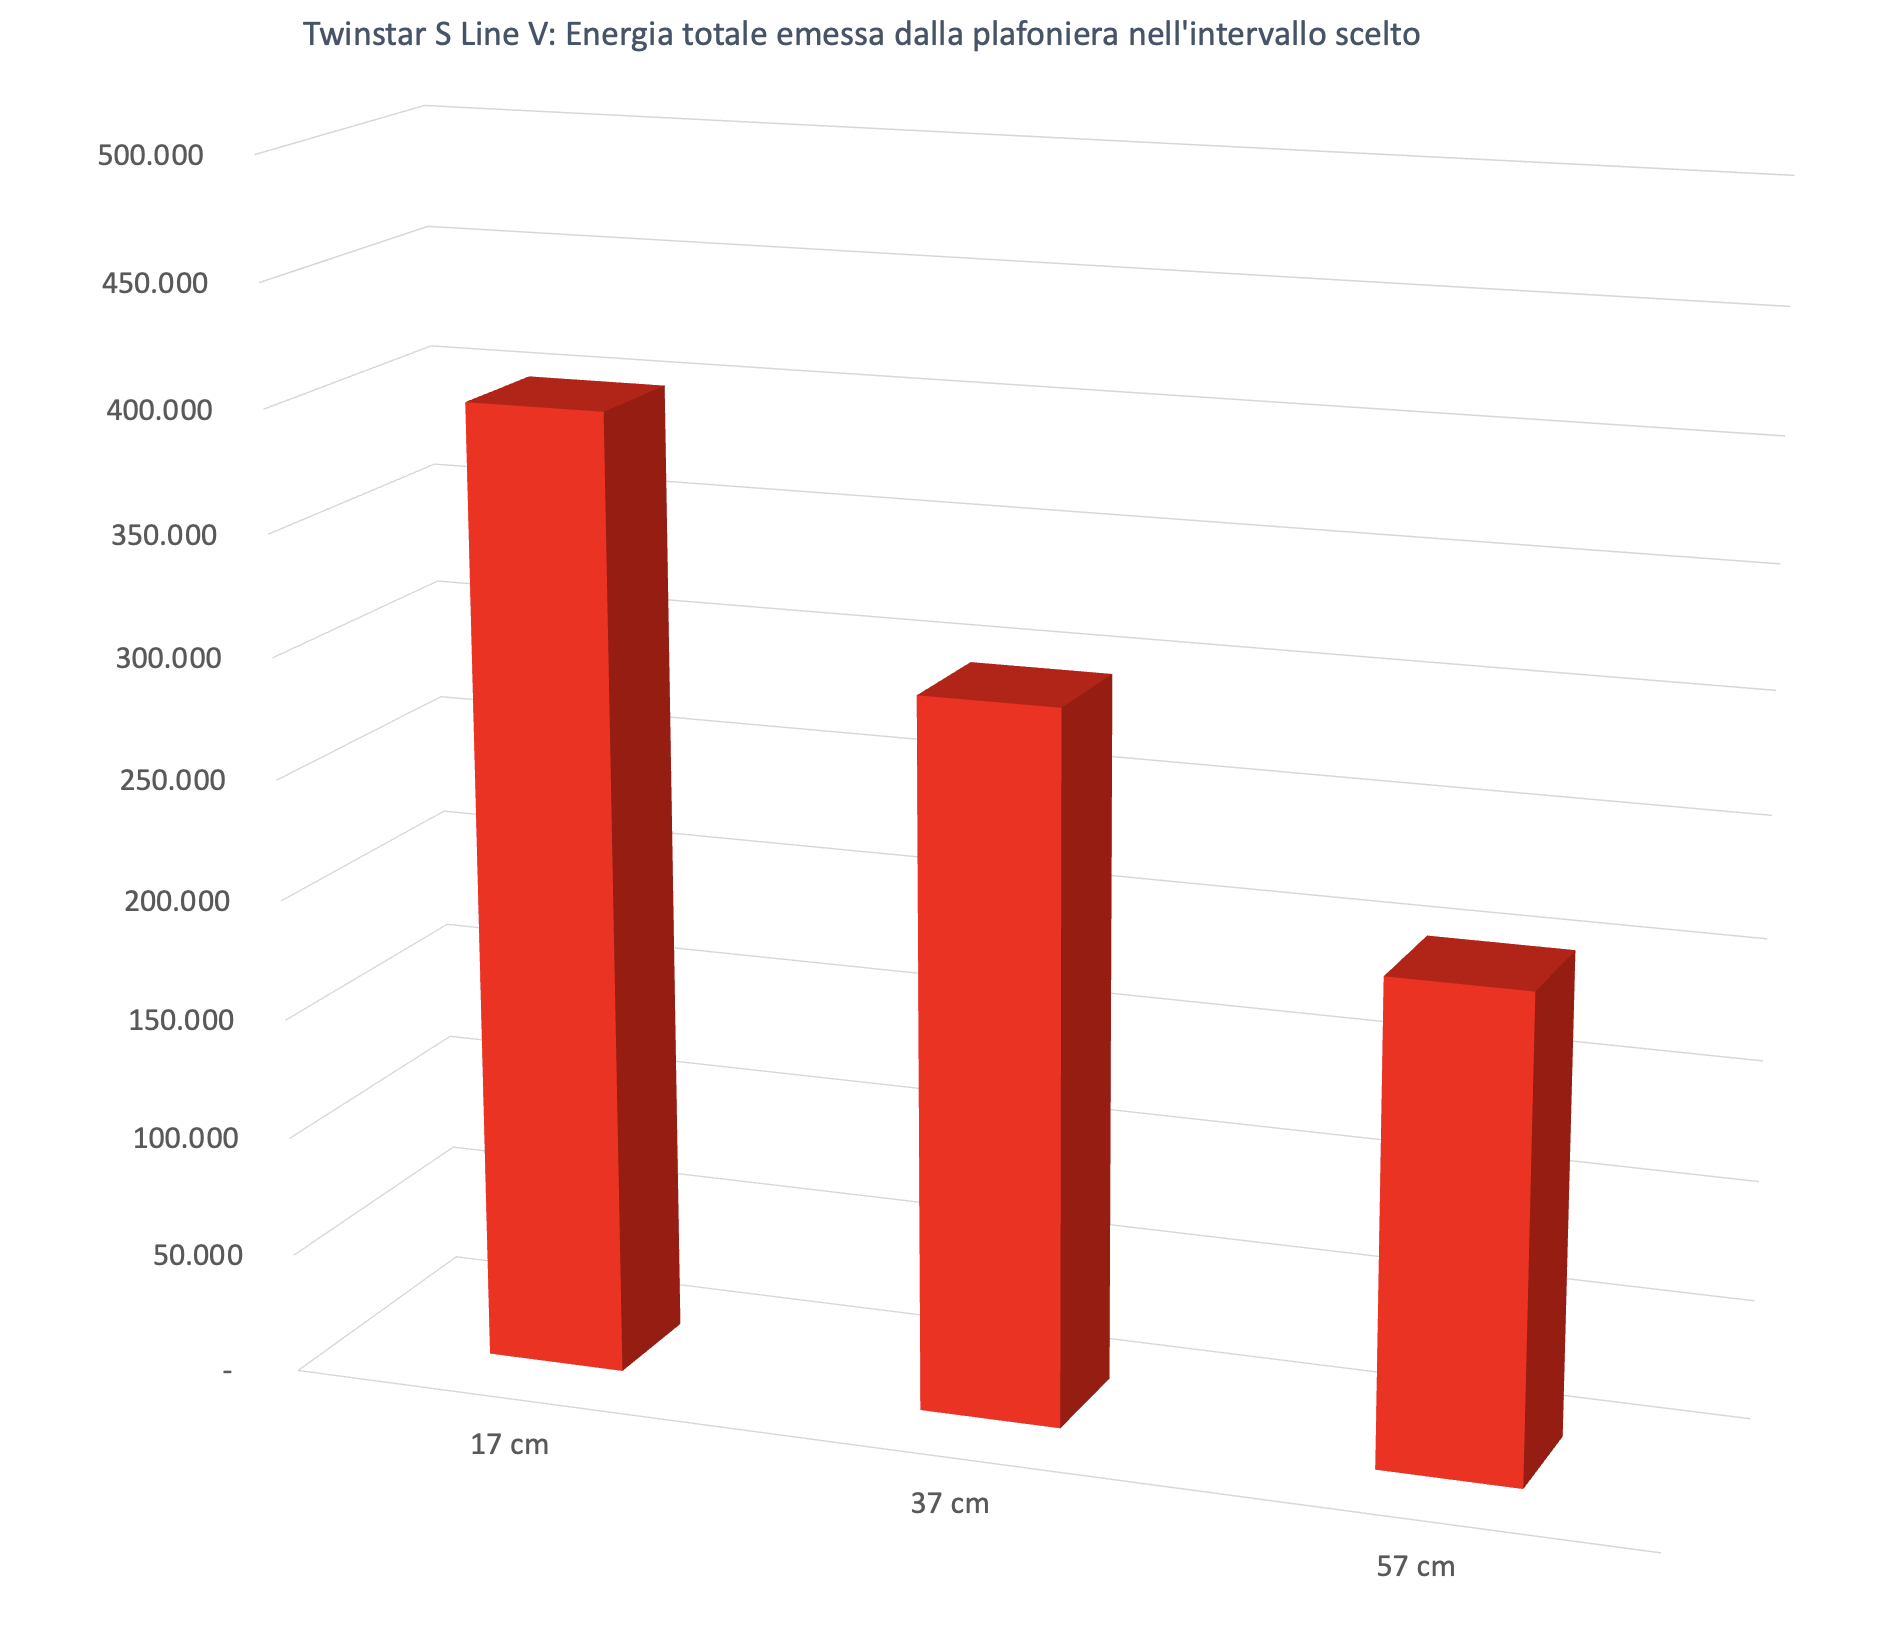
Looking at Boost Mode, the behavior is—unsurprisingly—the same, but values are significantly higher than in standard mode. Total energy at 17 cm rises from 320,000 to 399,000, a 25% increase.
Light spectrum and YPF (Yield Photon Flux)
Thanks to the ITC Reefculture PARwise PRO we also measured the emission spectrum and—for the first time in our LAB—the key YPF (Yield Photon Flux).
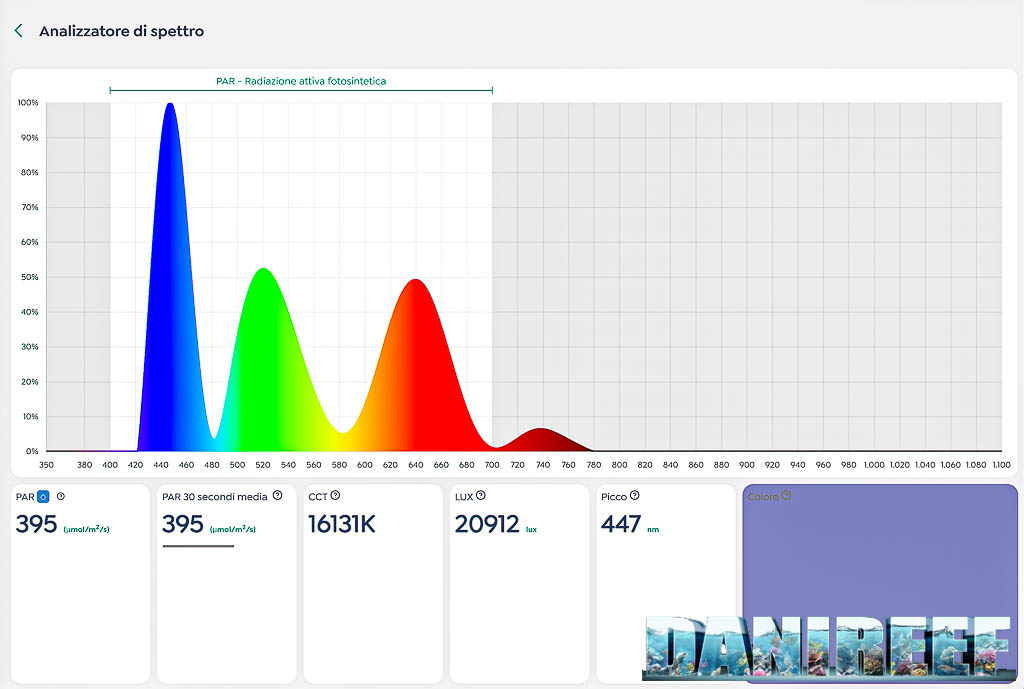
In the chart above you can see the detected spectrum: the maximum is around 447 nm, with 395 PAR and 20,912 lux at about 17 cm. Since PARwise sampling is at discrete points, the curve isn’t perfectly continuous, but it clearly shows wavelength distribution.
Comparing our result with the manufacturer’s spectrum, the curves are fairly consistent: clear peaks in blue, green, and red, confirming the philosophy behind Advanced Spectrum V3.0 developed by Twinstar. Our measurements highlight strong intensity in the blue region—crucial for photosynthesis—along with evident red contribution for coloration and growth. In our reading, blue is more prominent, while red and green appear at similar levels.
Overall, the measured spectrum confirms the fixture’s vocation for demanding planted aquariums, covering the photosynthetically active bands well and delivering very high emission even at short distances.
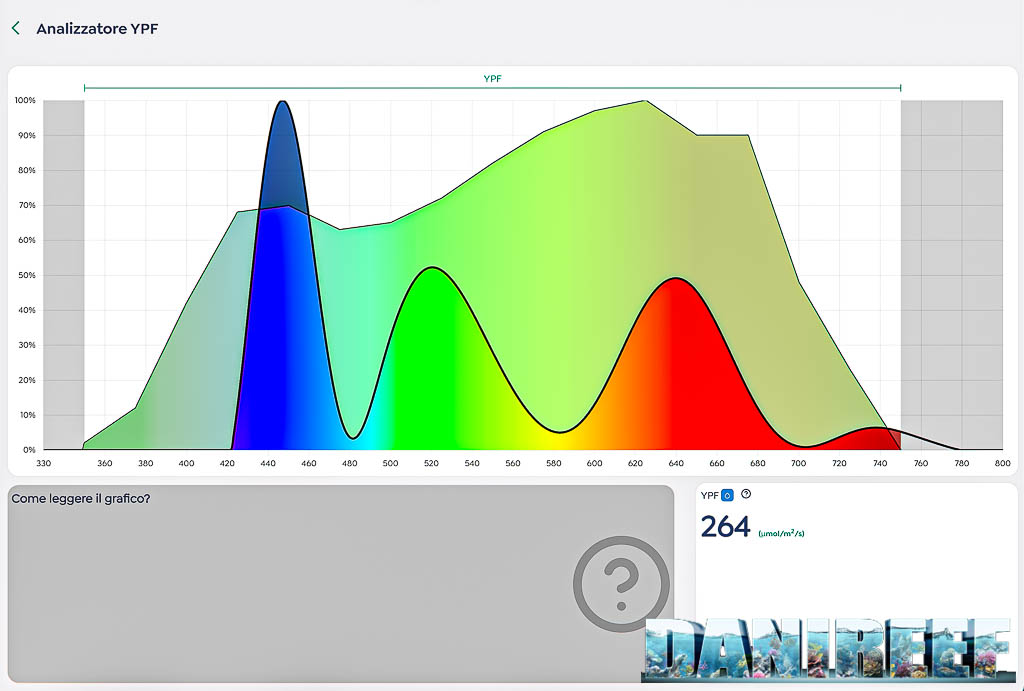
Above, the green curve represents the ideal Yield Photon Flux (YPF), i.e., the expected efficiency of a plant-perfect light source. Overlaid in color is the actual spectrum of the Twinstar S-Line V as measured by the PARwise PRO.
The fixture follows the theoretical curve quite well, with a clear peak around 447 nm in the blue—great for stimulating photosynthesis and compact growth—and with a solid contribution in the red. Interestingly, the green (500–580 nm) component is not lacking; it’s present and comparable to red. This yields a more natural perceived light and improves aquascape appearance without sacrificing photosynthetic efficiency.
The measured value of 264 μmol/m²/s YPF confirms that the Twinstar S-Line V not only outputs high PAR, but distributes it across a well-balanced spectrum suited to real plant needs.
Photosynthetic pigments
To assess a freshwater light, it’s important to compare its spectrum with plant photosynthetic pigments. In the next chart, the Twinstar S-Line V covers the main absorption bands of Chlorophyll A and B—fundamental for photosynthesis—as well as accessory pigments like Carotenoids, Fucoxanthin, and Peridinin, which broaden the usable spectrum.
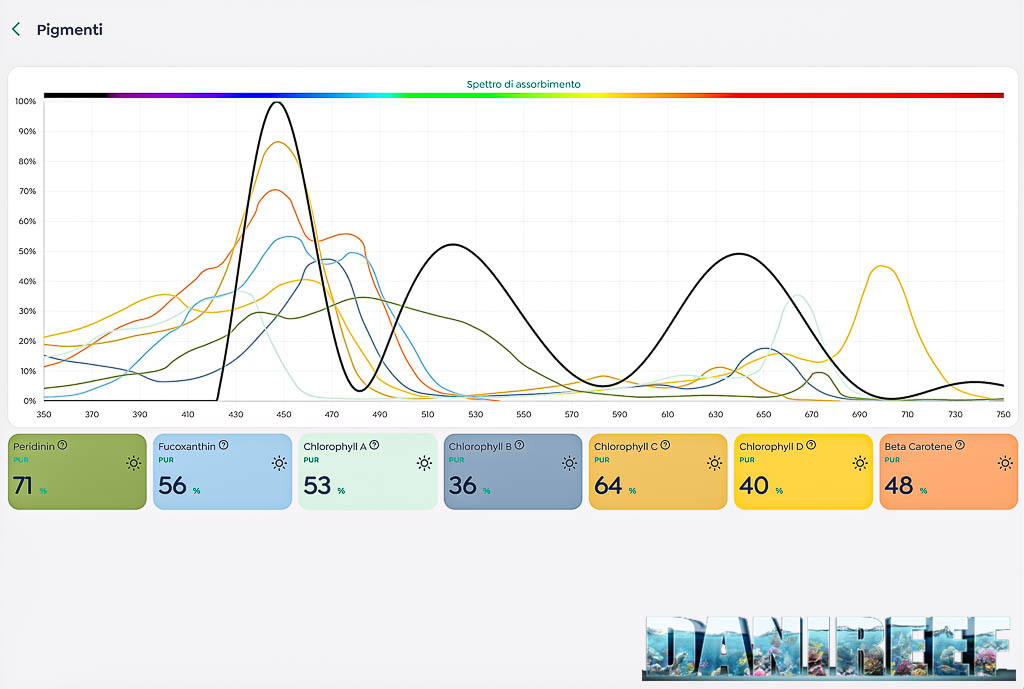
In particular, there’s a strong peak in the blue (about 430–460 nm), very effective for primary photosynthesis, and wide coverage in the red (650–670 nm), essential for growth and biomass production. PAR values confirm good efficiency: Peridinin reaches 71%, Fucoxanthin 56%, Chlorophyll A 53%, while Chlorophyll C and Chlorophyll C2 reach 36% and 64% respectively. Carotenoids and Beta-Carotene sit around 40–48%, completing the picture.
This distribution makes the Twinstar S-Line V a very well-balanced fixture, supplying aquatic plants with all the radiation needed for healthy growth, strong colors, and a complete photosynthetic metabolism.
How should we evaluate these numbers in a real tank?
Great question. At first we thought we could translate these figures to the aquarium as is. Then we filled a tank with water, immersed the probe, and repeated some measurements. The initial results surprised us: while readings at 20 cm are nearly identical, as you go deeper—due to glass reflections and the water itself scattering light—values can even double compared to air. Obviously this can’t be standardized, so we believe our methodology is the most correct way to compare coverage among different fixtures.
Heat generated by the housing
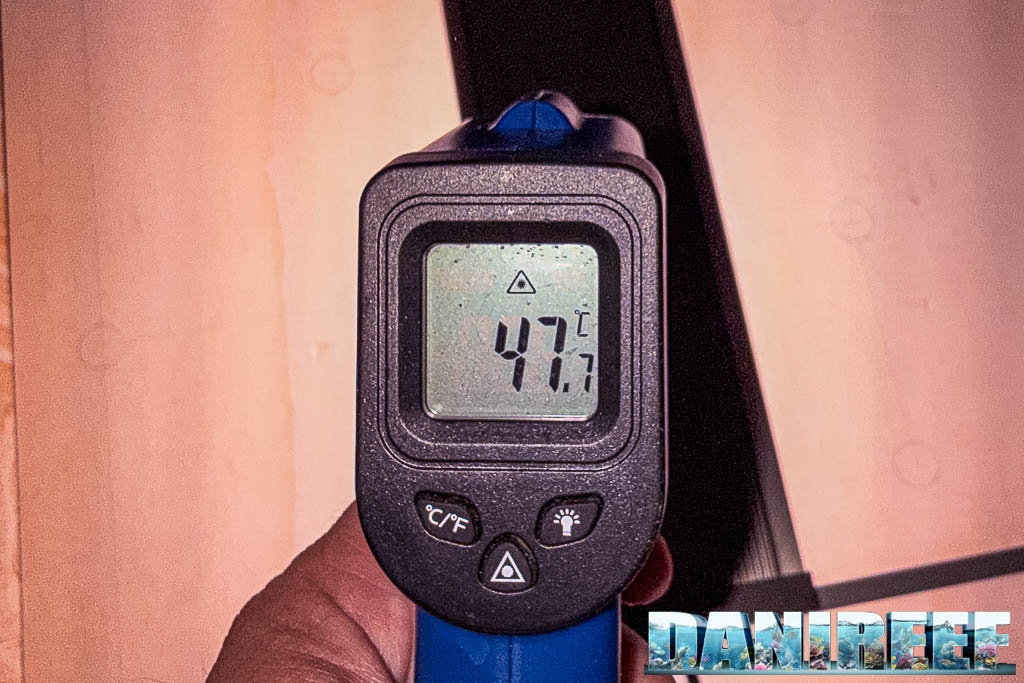
For the first time in our tests, we also measured the surface temperature of the housing to directly assess the fixture’s thermal dissipation.
For the Twinstar S-Line V, after prolonged operation we recorded a maximum of about 47.7 °C.
This temperature is fully in line with what you’d expect from a LED fixture of this power: low enough to be safe in daily use, yet indicative of a good balance between luminous efficiency and heat dissipation. It’s an interesting data point that enriches our overall evaluation and will be useful for future comparisons.
Power consumption of the Twinstar S-Line V
Instant power draw was measured with the handy RCE PM600, which can also read the power factor (cos φ, or phase shift). Results are provided directly in watts.
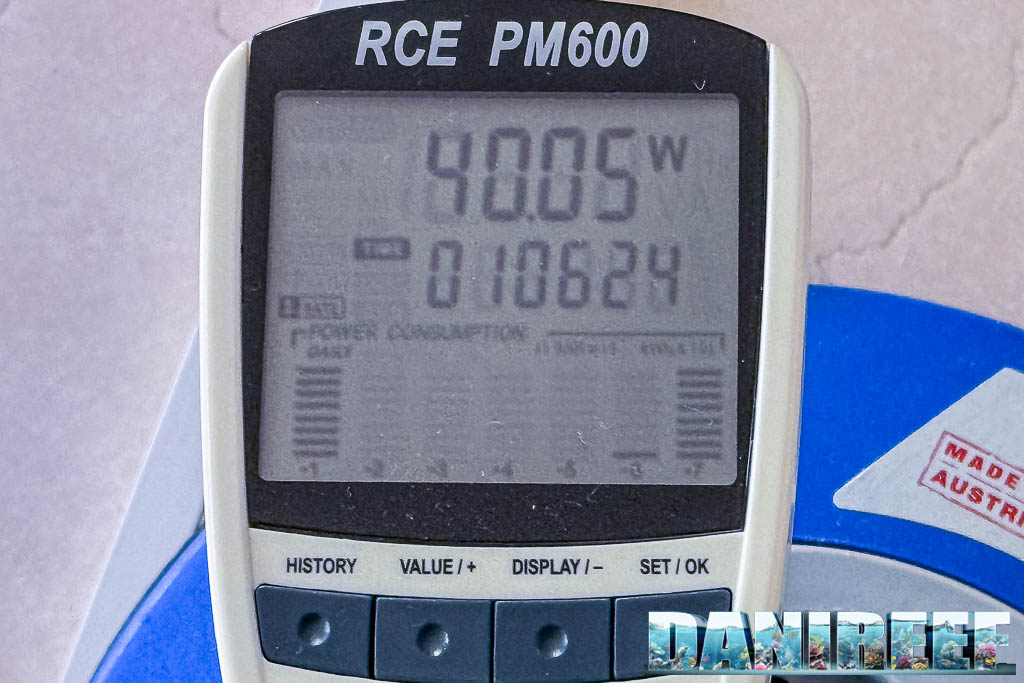
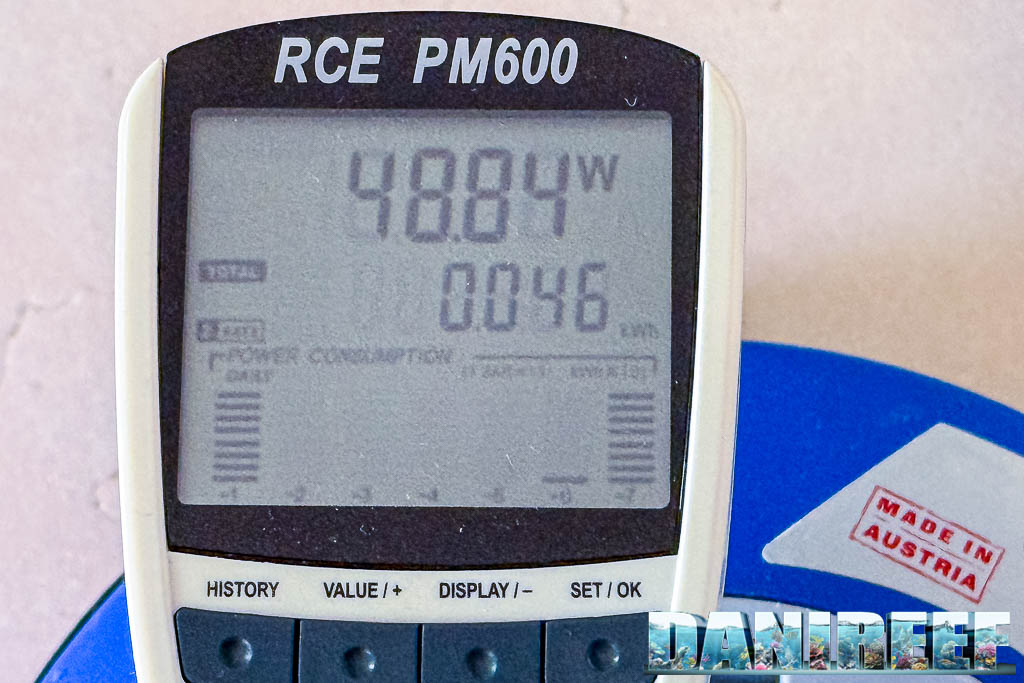
The Twinstar S-Line V recorded a real consumption of about 40 W, significantly higher than the 27 W rated. In Boost Mode it rises to ~49 W, matching the PAR increase we measured. At 17 cm we read 389 μmol m⁻² s⁻¹ (~9.7 μmol m⁻² s⁻¹/W) and in Boost 484 μmol m⁻² s⁻¹ (~9.9 μmol m⁻² s⁻¹/W). These numbers place it among the best-performing freshwater fixtures we’ve tested, despite the higher-than-rated draw.
The Twinstar S-Line V has a retail price of €144.90. We measured about 40 W of real power draw (vs the manufacturer’s 27 W), rising to 49 W in Boost Mode.
Relating cost to real consumption yields roughly €3.62 per watt in standard mode, dropping to €2.95 per watt when considering maximum draw in Boost Mode.
This makes it a slightly higher investment than some entry-level options, but justified by performance and the high luminous efficiency recorded in our tests.
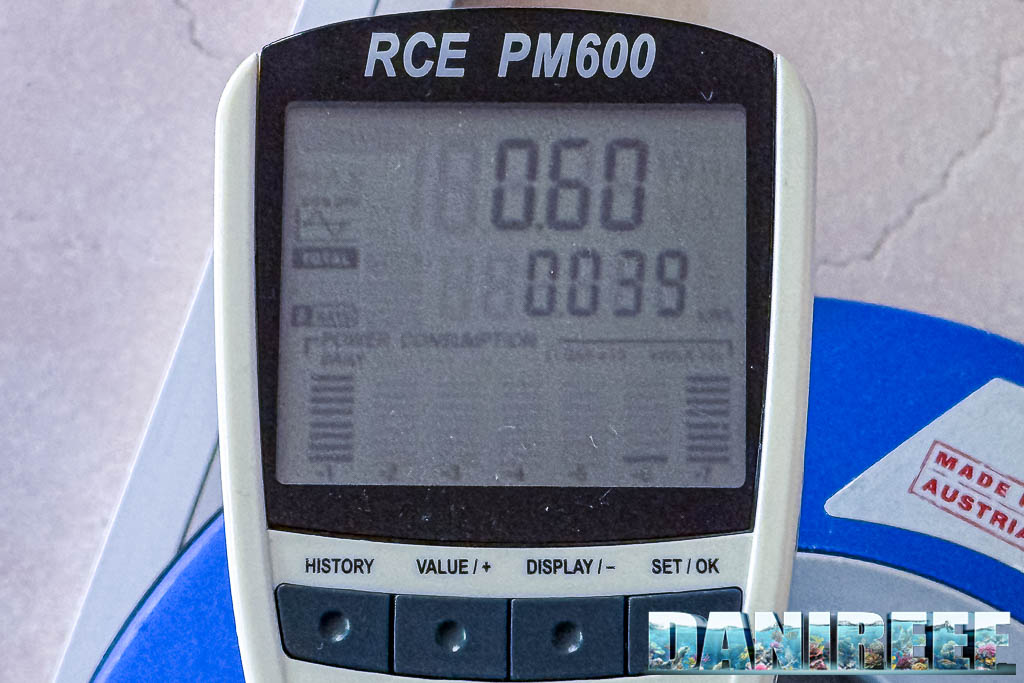
From our measurements the power factor, cos φ, is around 0.60: not particularly high (indicating some reactive power), but in line with many consumer LED fixtures. It doesn’t affect your electricity bill (which charges active power), but it does imply higher circulating current and thus a bit more heat in the components. A detail Twinstar could improve in future versions.
Which plants suit this light?
Now that we’ve seen the PAR delivered by the Twinstar S-Line V, which plants can we reasonably grow with it? The answer is straightforward: by also leveraging Boost Mode, you can realistically grow virtually any plant with this lighting.
For this we used a table from Seneye listing the PAR ranges recommended for each plant type. You can find it on this page; we’ve also reproduced it below to make it easier to follow our discussion. In our table you can select a plant and see its minimum, ideal, and maximum PAR values.
| Genus | Species | Lighting Requirement |
PAR Min |
PAR Ideal |
PAR Max |
|---|---|---|---|---|---|
| Anubias | angustifolia | — | 40 | 125 | 200 |
| Anubias | barteri | — | 40 | 75 | 125 |
| Anubias | nana | — | 40 | 75 | 125 |
| Anubias | Species | — | 40 | 100 | 200 |
| Aponogeton | Species | High | 100 | 150 | 200 |
| Bacopa | monnieri | — | 100 | 175 | 250 |
| Bacopa | Species | — | 100 | 175 | 250 |
| Cabomba | caroliniana | Medium | 100 | 150 | 200 |
| Cabomba | Species | High | 100 | 150 | 250 |
| Crinum | Species | High | 100 | 150 | 200 |
| Cryptocoryne | beckettii | — | 50 | 125 | 200 |
| Cryptocoryne | wendtii | — | 50 | 125 | 200 |
| Cryptocorynes | Species | Low | 40 | 50 | 200 |
| Echinodorus | barthii | High | 150 | 200 | 250 |
| Echinodorus | bleheri | Low–Very High | 40 | 175 | 250 |
| Echinodorus | macrophyllus | Average to High | 50 | 150 | 200 |
| Echinodorus | osiris | Average to High | 50 | 150 | 200 |
| Echinodorus | Ozelot | — | 50 | 150 | 200 |
| Echinodorus | palaefolius | — | 100 | 200 | 250 |
| Echinodorus | quadricostatus | — | 50 | 150 | 200 |
| Echinodorus | Rose | — | 50 | 100 | 150 |
| Echinodorus | Rubin | — | 50 | 150 | 200 |
| Echinodorus | tenellus | — | 100 | 150 | 200 |
| Echinodorus | uruguayensis | — | 75 | 175 | 250 |
| Echinodorus | Species | Medium | 50 | 100 | 150 |
| Hygrophila | polysperma | — | 150 | 200 | 250 |
| Hygrophila | Species | — | 150 | 200 | 250 |
| Lilaeopsis | Species | High | 100 | 150 | 200 |
| Limnophila | Species | High | 100 | 150 | 200 |
| Ludwigia | Species | High | 100 | 150 | 200 |
| Microsorum | pteropus | — | 40 | 125 | 200 |
| Microsorum | Species | — | 40 | 125 | 200 |
| Myriophyllum | Species | High | 100 | 150 | 200 |
| Nesea | Species | High | 100 | 150 | 200 |
| Nymphaea | Species | High | 100 | 150 | 200 |
| Pogostemon | Species | High | 100 | 150 | 200 |
| Rotala | Species | High | 100 | 150 | 200 |
| Sagittaria | Species | High | 100 | 150 | 200 |
| Vesicularia | dubyana | — | 40 | 125 | 200 |
| Vesicularia | Species | — | 40 | 125 | 200 |
| Vallisneria | americana | — | 50 | 150 | 200 |
| Vallisneria | spiralis | — | 40 | 150 | 200 |
| Egeria | densa | — | 100 | 150 | 250 |
| Egeria | Species | — | 100 | 150 | 250 |
As you saw at 17 cm—what we can consider the upper portion of the aquarium—we measured a peak of 389 μmol m⁻² s⁻¹ in standard mode, rising to 484 in Boost mode. That’s enough to grow virtually any plant—actually enough to risk burning them, so be careful! Even at 37 cm—just below mid-tank—we still have a peak of 125 μmol m⁻² s⁻¹, or 156 in Boost, which is still ideal for practically every plant. A single fixture can be a bit limited on the bottom with a peak of 62 μmol m⁻² s⁻¹—still more than sufficient for all Anubias species, for example—but with Boost at 77 μmol m⁻² s⁻¹ you may avoid buying a second light.
Conclusions
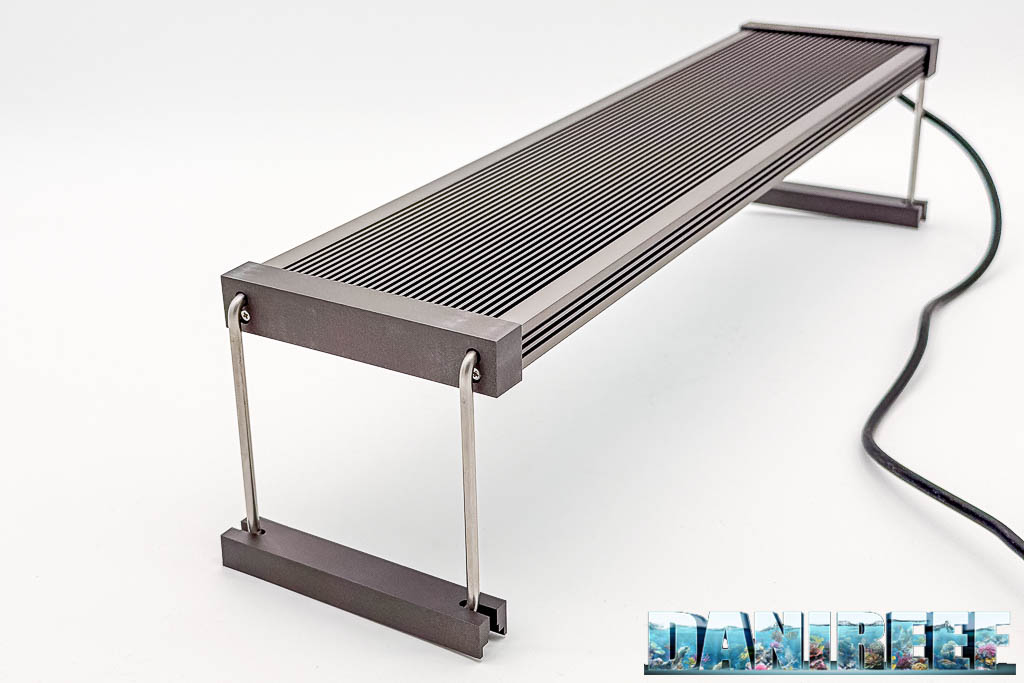
The fixture is beautifully built, with elegant design and sturdy materials. Technical efficiency (PAR per watt) proved very high and, thanks to Boost Mode, the achieved values allow you to grow even very demanding plants in larger tanks.
The cost per PAR remains competitive: the measured values let you handle medium–high light layouts with ease, and with Boost Mode even high-light setups with carpets and red plants. Of course, values decrease further down the water column, yet they remain sufficient even in deep tanks up to 50–60 cm.
With a price around €145, the Twinstar S-Line V positions itself as a high-end light able to satisfy demanding enthusiasts without real compromises. The integrated controller is also excellent—simple yet powerful—letting you manage every aspect of the fixture properly.
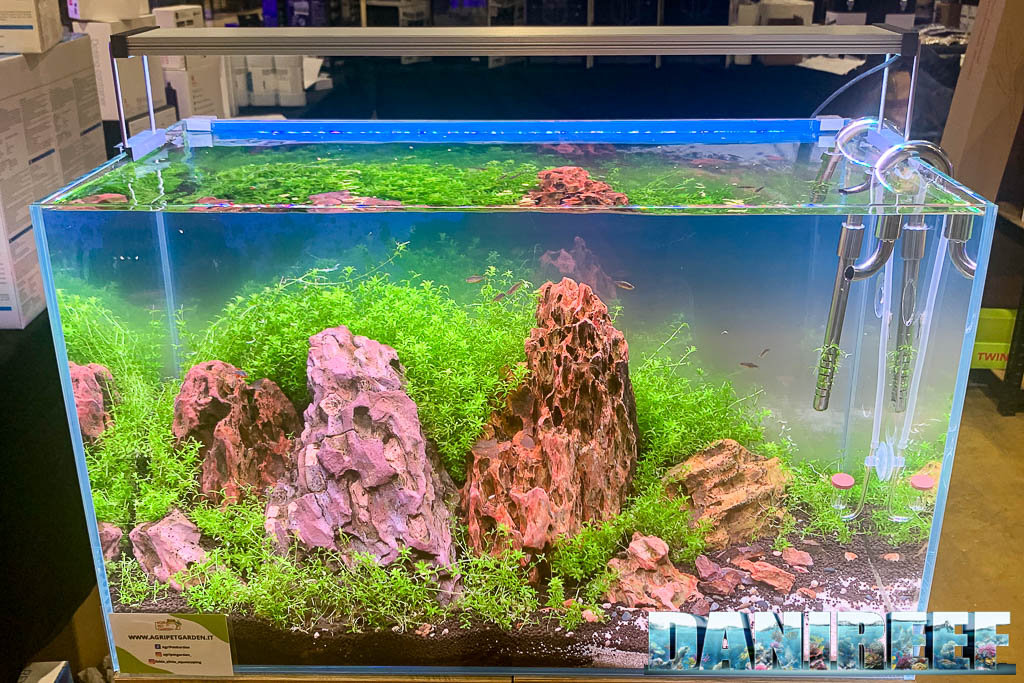
And don’t worry—we’ve now put it to the test on Federico’s aquarium, and we’ll meet again in a few months to talk about real-world results!
Have you already tried the new Twinstar S-Line V on your tank? Tell us about your experience in the comments or on our DaniReef Forum. Don’t miss the next articles, reviews, and reports: follow us on Facebook, Instagram, YouTube, TikTok, Telegram, X/Twitter, and LinkedIn.
Transparency disclaimer: This article is based on instrumental tests carried out in the DaniReef LAB (PAR/PPFD, coverage maps, power draw and power factor). The Twinstar S-Line V sample was provided by Twinstar Europe for testing; no payment was received and Twinstar Europe did not review or approve the text prior to publication. Conclusions reflect only the collected data and the author’s experience. Some links may be affiliate links: if you purchase through them, DaniReef may receive a small commission at no extra cost to you.
Scopri di più da DaniReef - Portale dedicato a Acquario Marino e Dolce
Abbonati per ricevere gli ultimi articoli inviati alla tua e-mail.


")

")


