


The DaniReef LAB workflow for PAR measurements
During many late-night discussions on our forum (here) we wondered how to compare PAR values across different fixtures. Today we use the Apogee Quantum Meter MQ-510 and the ITC Reefculture PARwise PRO.
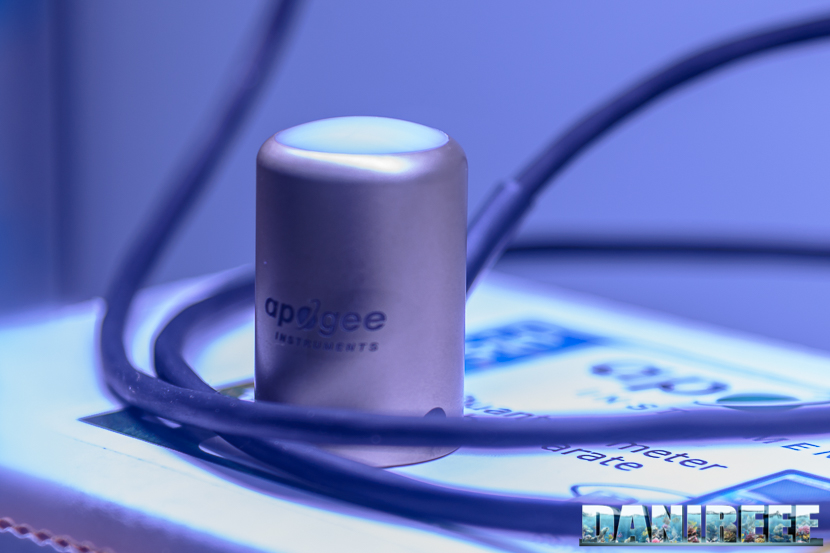
The Quantum Meter MQ-510 measures PAR, expressed as PPFD—photosynthetic photon flux density—in μmol m⁻² s⁻¹. This device is calibrated for underwater use, so when readings are taken in air the measured value must be divided by 1.32, the immersion correction factor. Since our tests shown here were done in air, we apply that conversion. The values you see are always corrected.

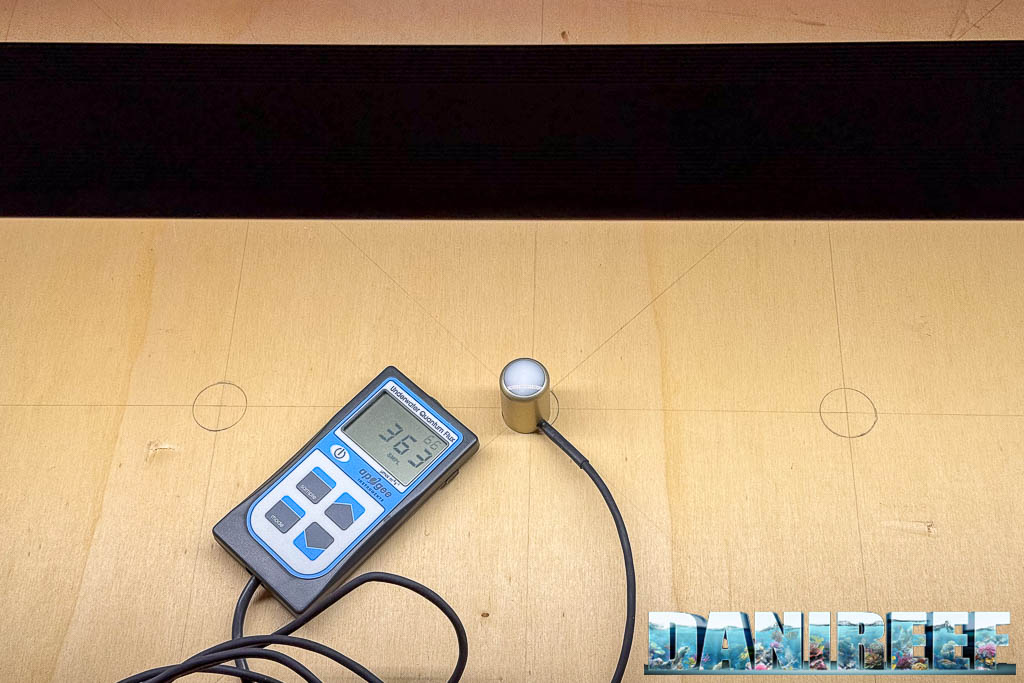
We built a 70 × 70 cm board with 17 reference points where we place the MQ-510 sensor. To position the light we created risers at 20, 40 and 60 cm, ensuring a constant sensor–fixture distance. This lets us map spatial curves that can be compared with other fixtures at the same distances. Note that distance is measured from the sensor base to the fixture base. In practice, subtract 3.5 cm (sensor cylinder height) and add 0.5 cm (spacers lifting the light).
In total, measurements are taken in air at 17, 37 and 57 cm, and the correction factor is applied.
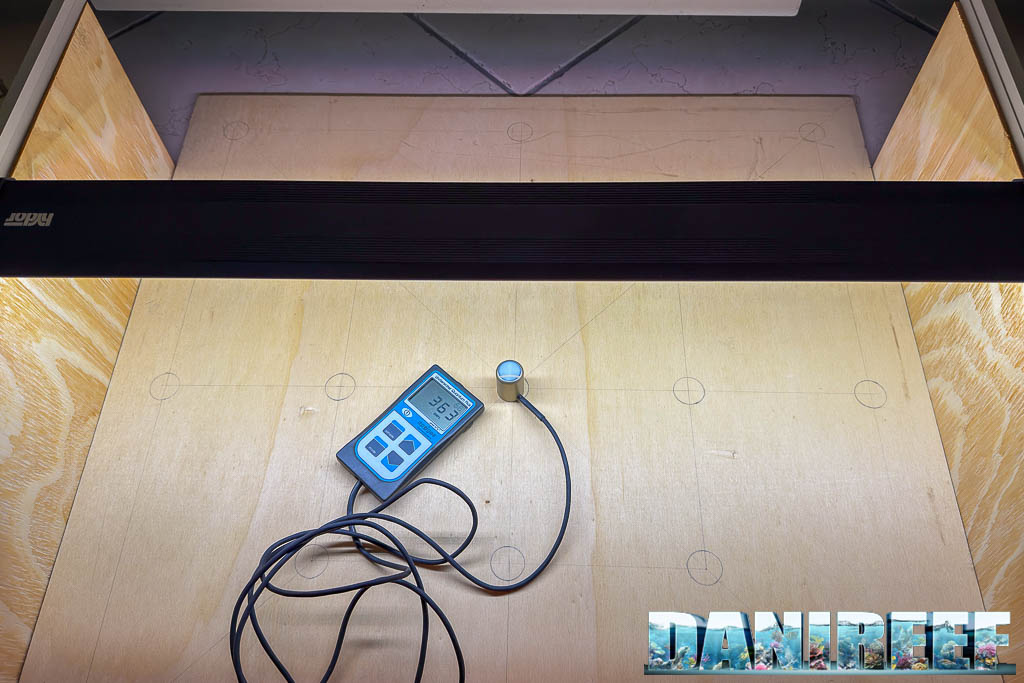
Above you can see our measurement board, with spacers holding the LED bar 17 cm above the board, so the setup is identical for any fixture we test and comparisons are easier.
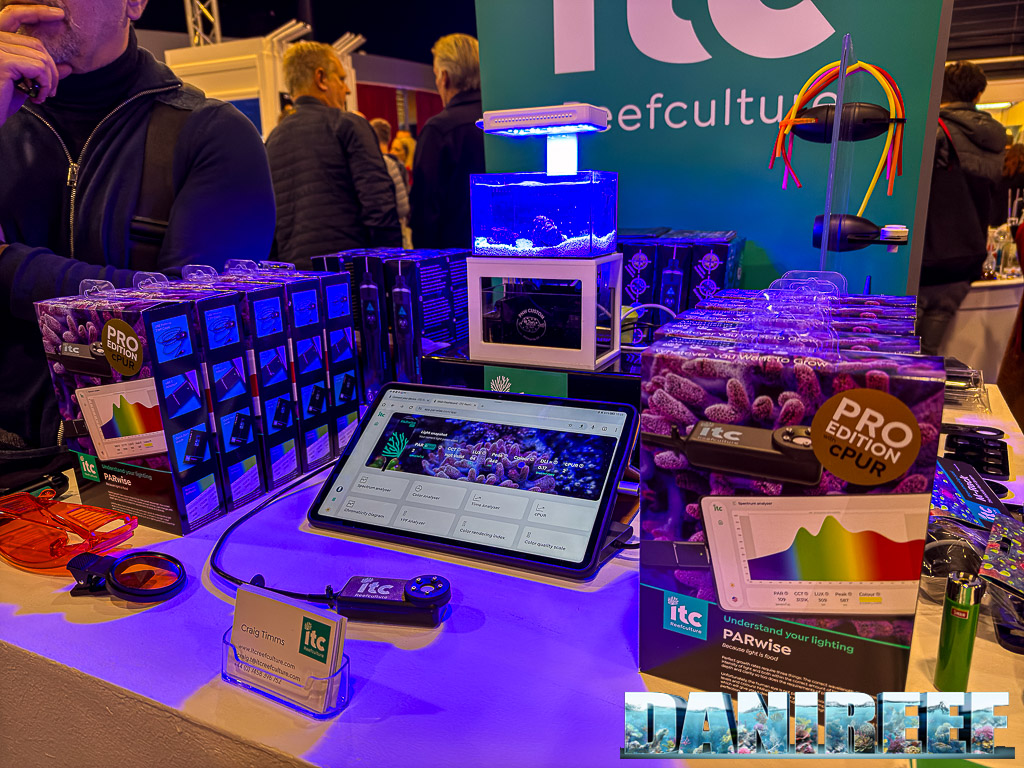
Alongside this system we use the new ITC PARwise PRO, which reads PAR, generates a spectral analysis, and—most importantly—evaluates the Yield Photon Flux or YPF. YPF is designed to measure how effective light truly is at supporting photosynthesis and therefore plant growth.
Unlike PAR, which counts all photons equally, YPF weights photons by their real usefulness relative to the photosynthetic absorption curve. In other words, not all wavelengths are equally productive for photosynthesis. This metric helps identify which parts of the spectrum most contribute to biomass development, making it easier to optimize lighting systems and get the most from available energy.
In short: while PAR tells us how much light arrives, YPF tells us how much of that light truly helps the plants.
PAR measurements at 17, 37 and 57 cm
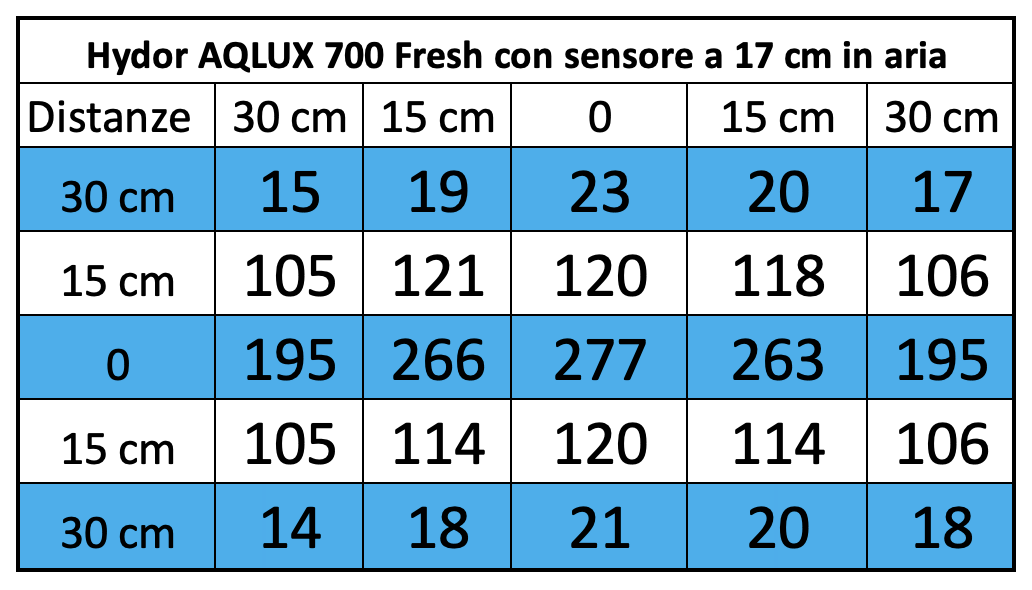
The tables above show analytical PAR data at the stated distances—treated as if the entire path were water—followed by the related coverage charts. The scale is identical to the one used for every other freshwater fixture we’ve measured (and will measure). You can find all freshwater lighting reviews at this link.
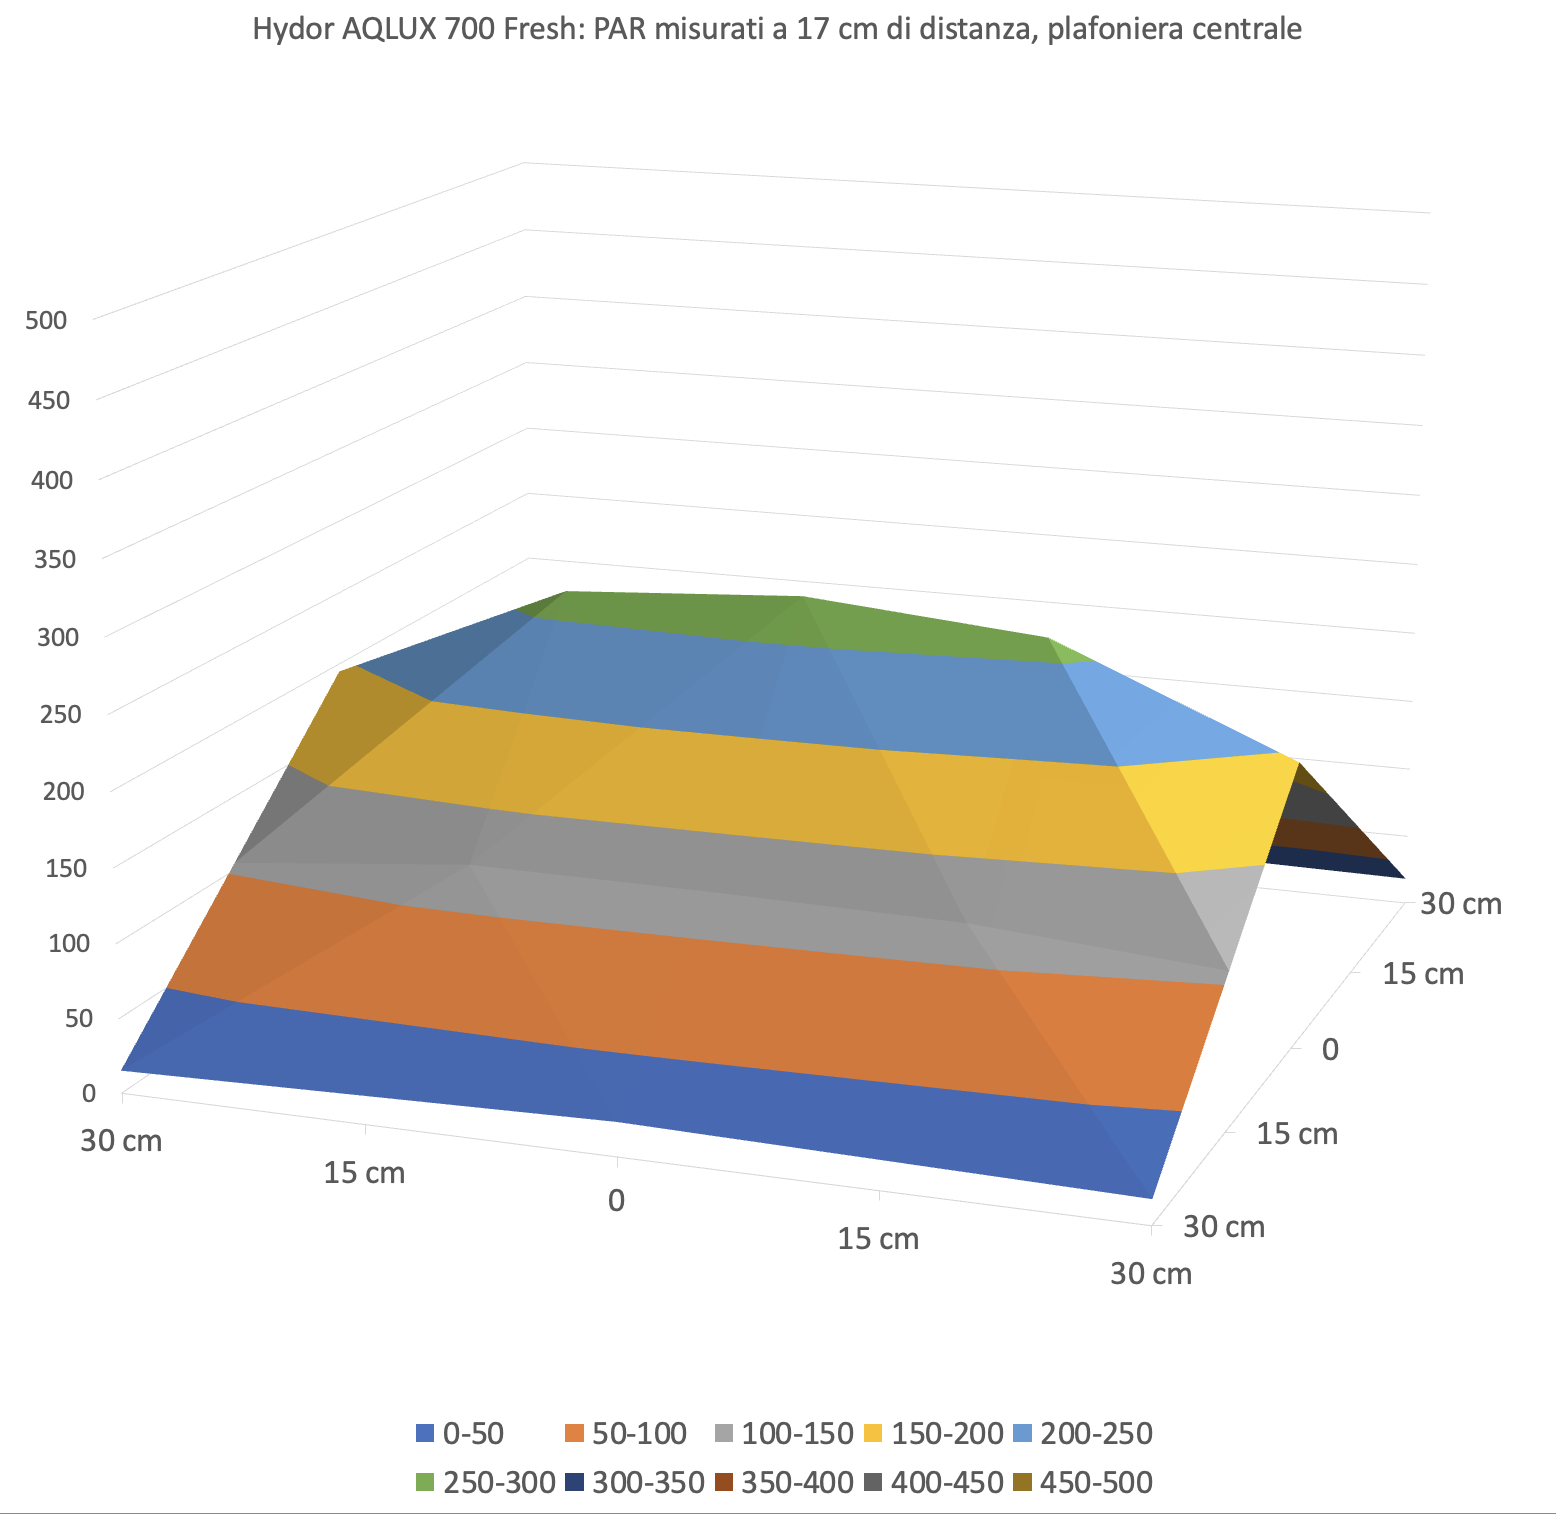
At 17 cm
The bar creates a tent-like curve, with excellent uniformity between the central value and the lateral minima. Unlike classic fixtures, the fall-off is very linear given we’re ~20 cm from the source. Brightness tapers slightly at the sides, so horizontal performance is almost uniform. Note the manufacturer claims 270 PAR at 15 cm; we measured even more at a slightly greater distance! Well done, Hydor!
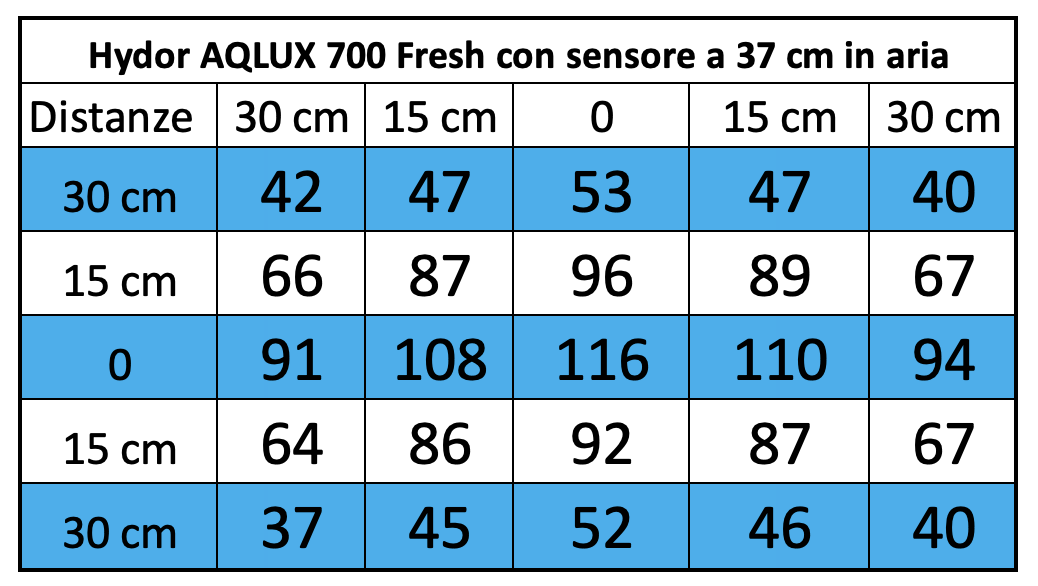
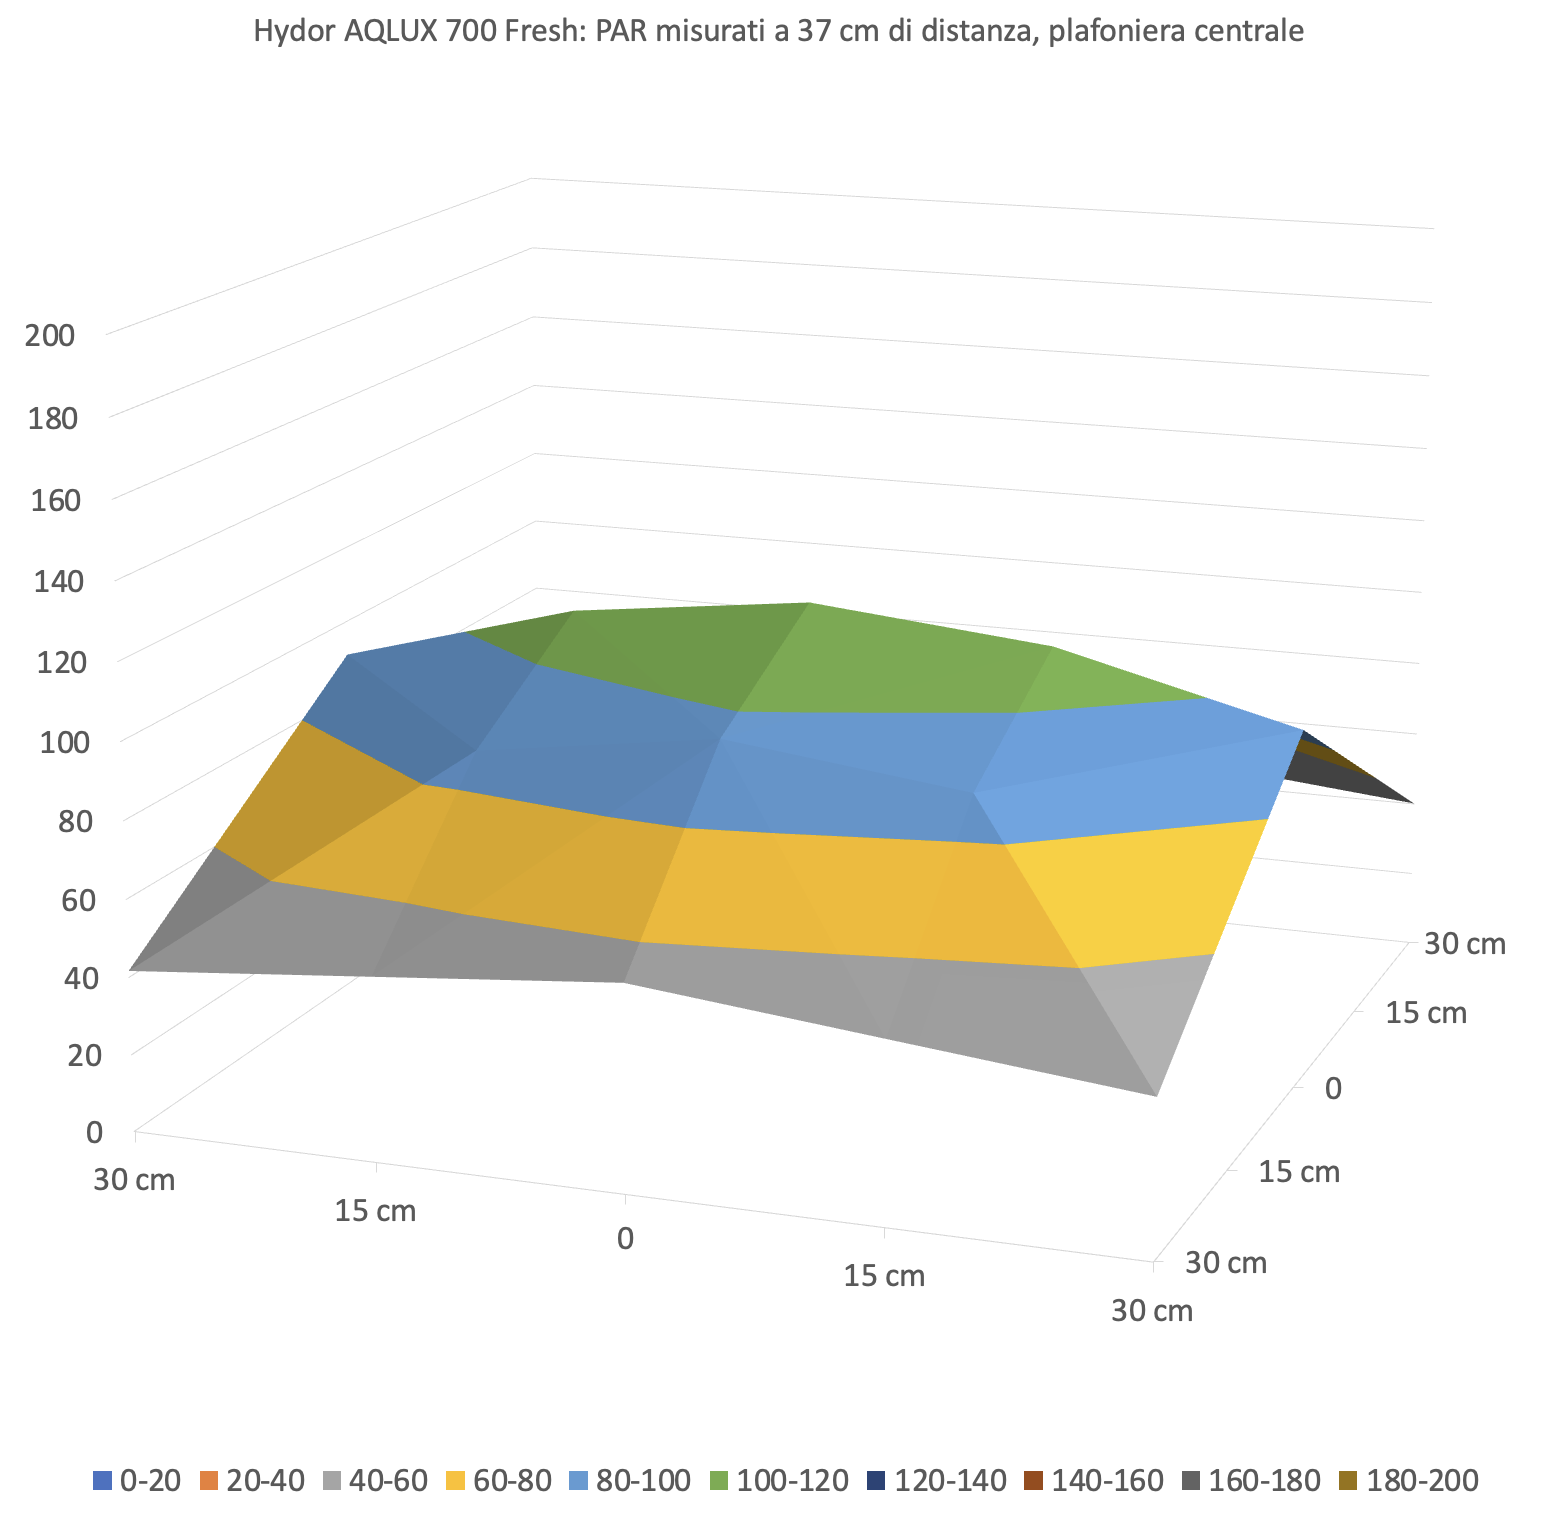
At 37 cm
As the light–sensor distance increases, the difference between center and edge PAR narrows. The beam spreads significantly and the peak center value drops from 277 to 116 μmol m⁻² s⁻¹ (measured at the two brightest points). Hydor states 110 PAR at 30.5 cm; we measured 116 at 37 cm!
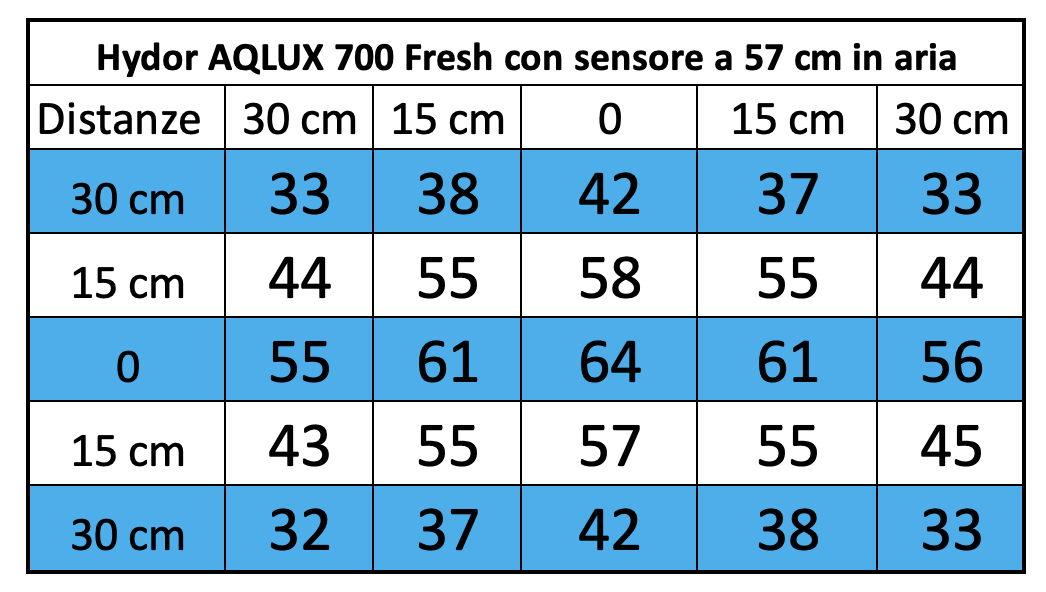
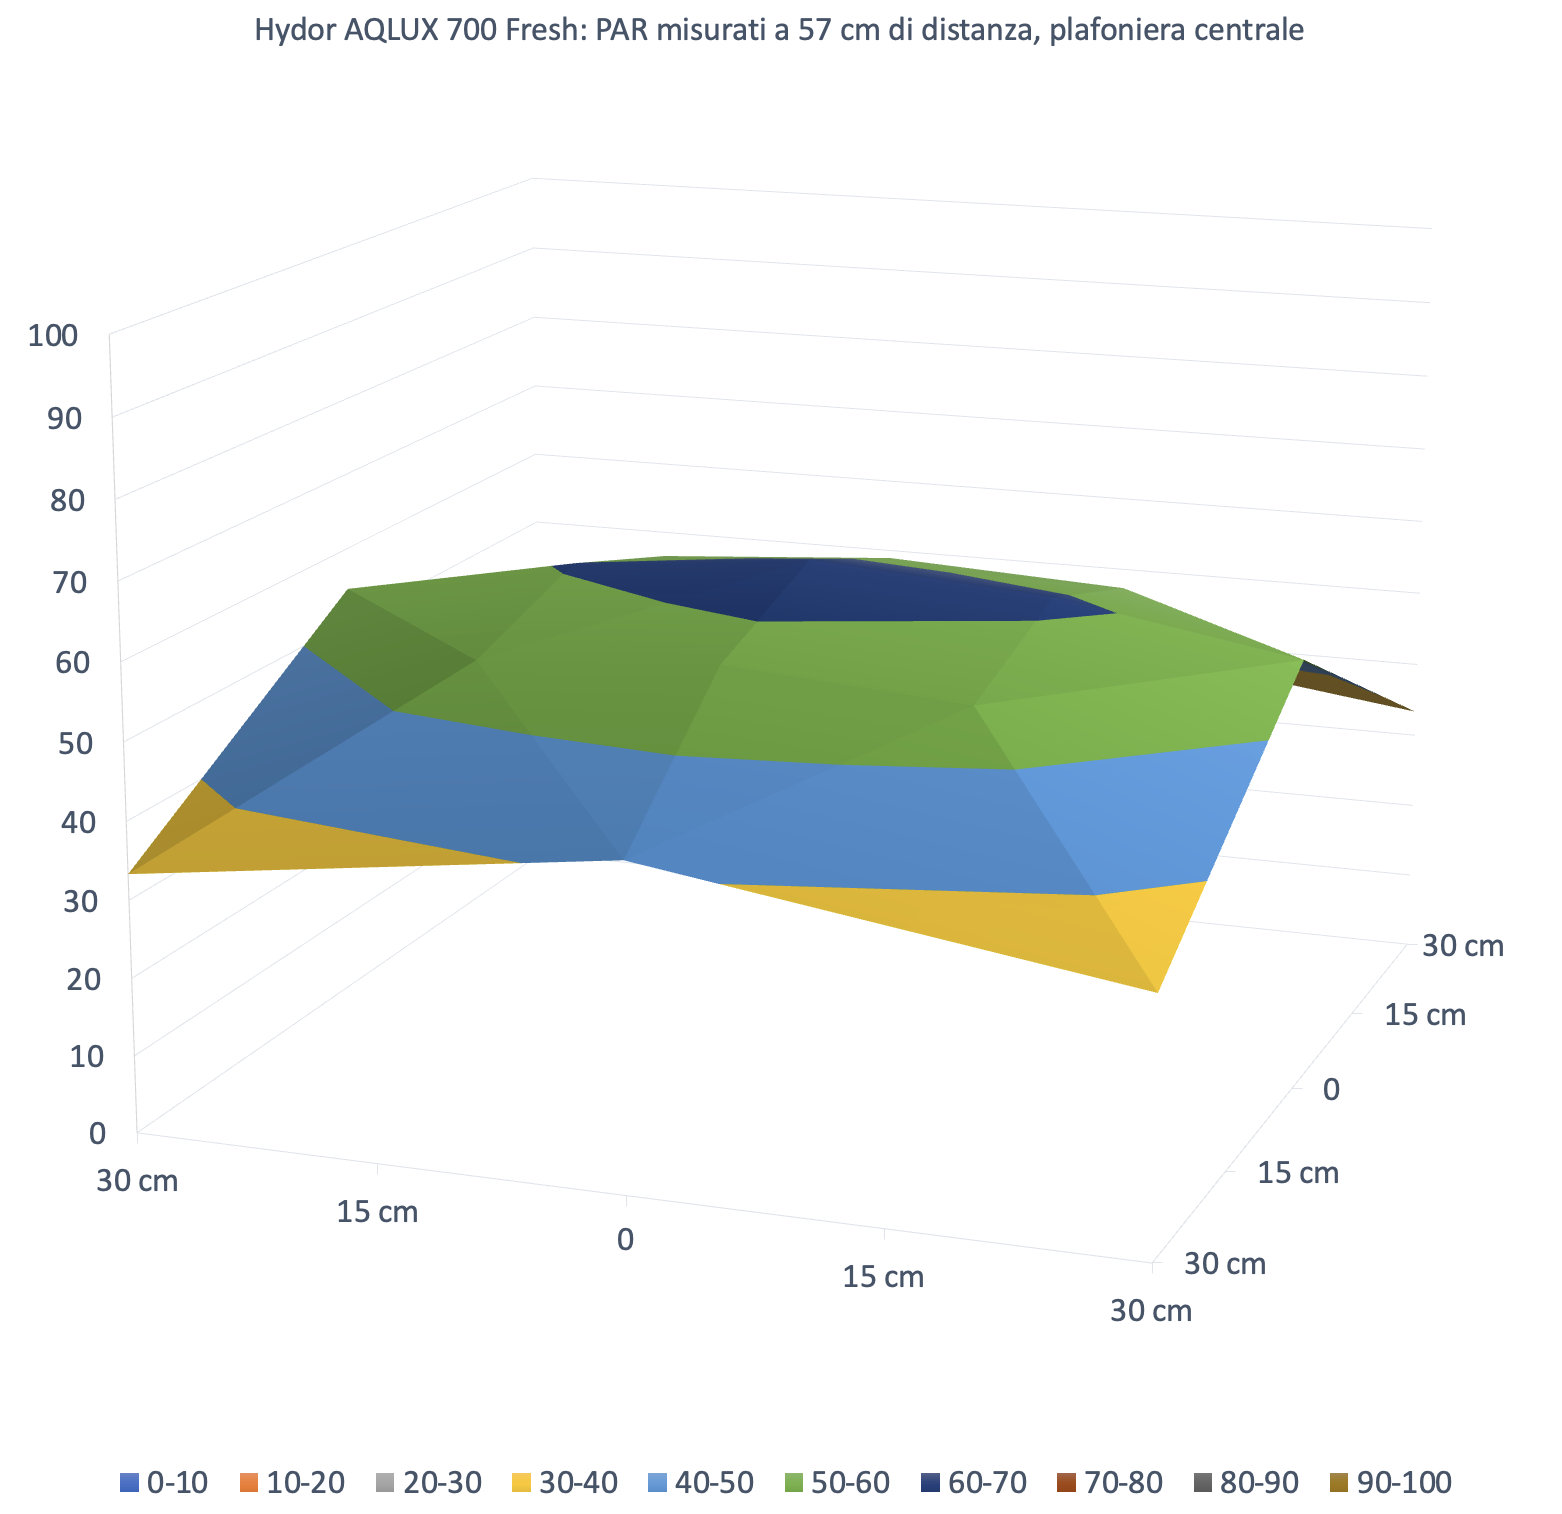
At 57 cm
Increasing the distance further, uniformity improves again—here it’s practically perfect. The center value steps down from 277 to 116 to 64 μmol m⁻² s⁻¹. At what we assume is the substrate level, you get an enviable distribution, albeit with lower intensity.
Center PAR and Total Energy
The next two charts show how center PAR changes with distance, and how total emitted energy decreases.
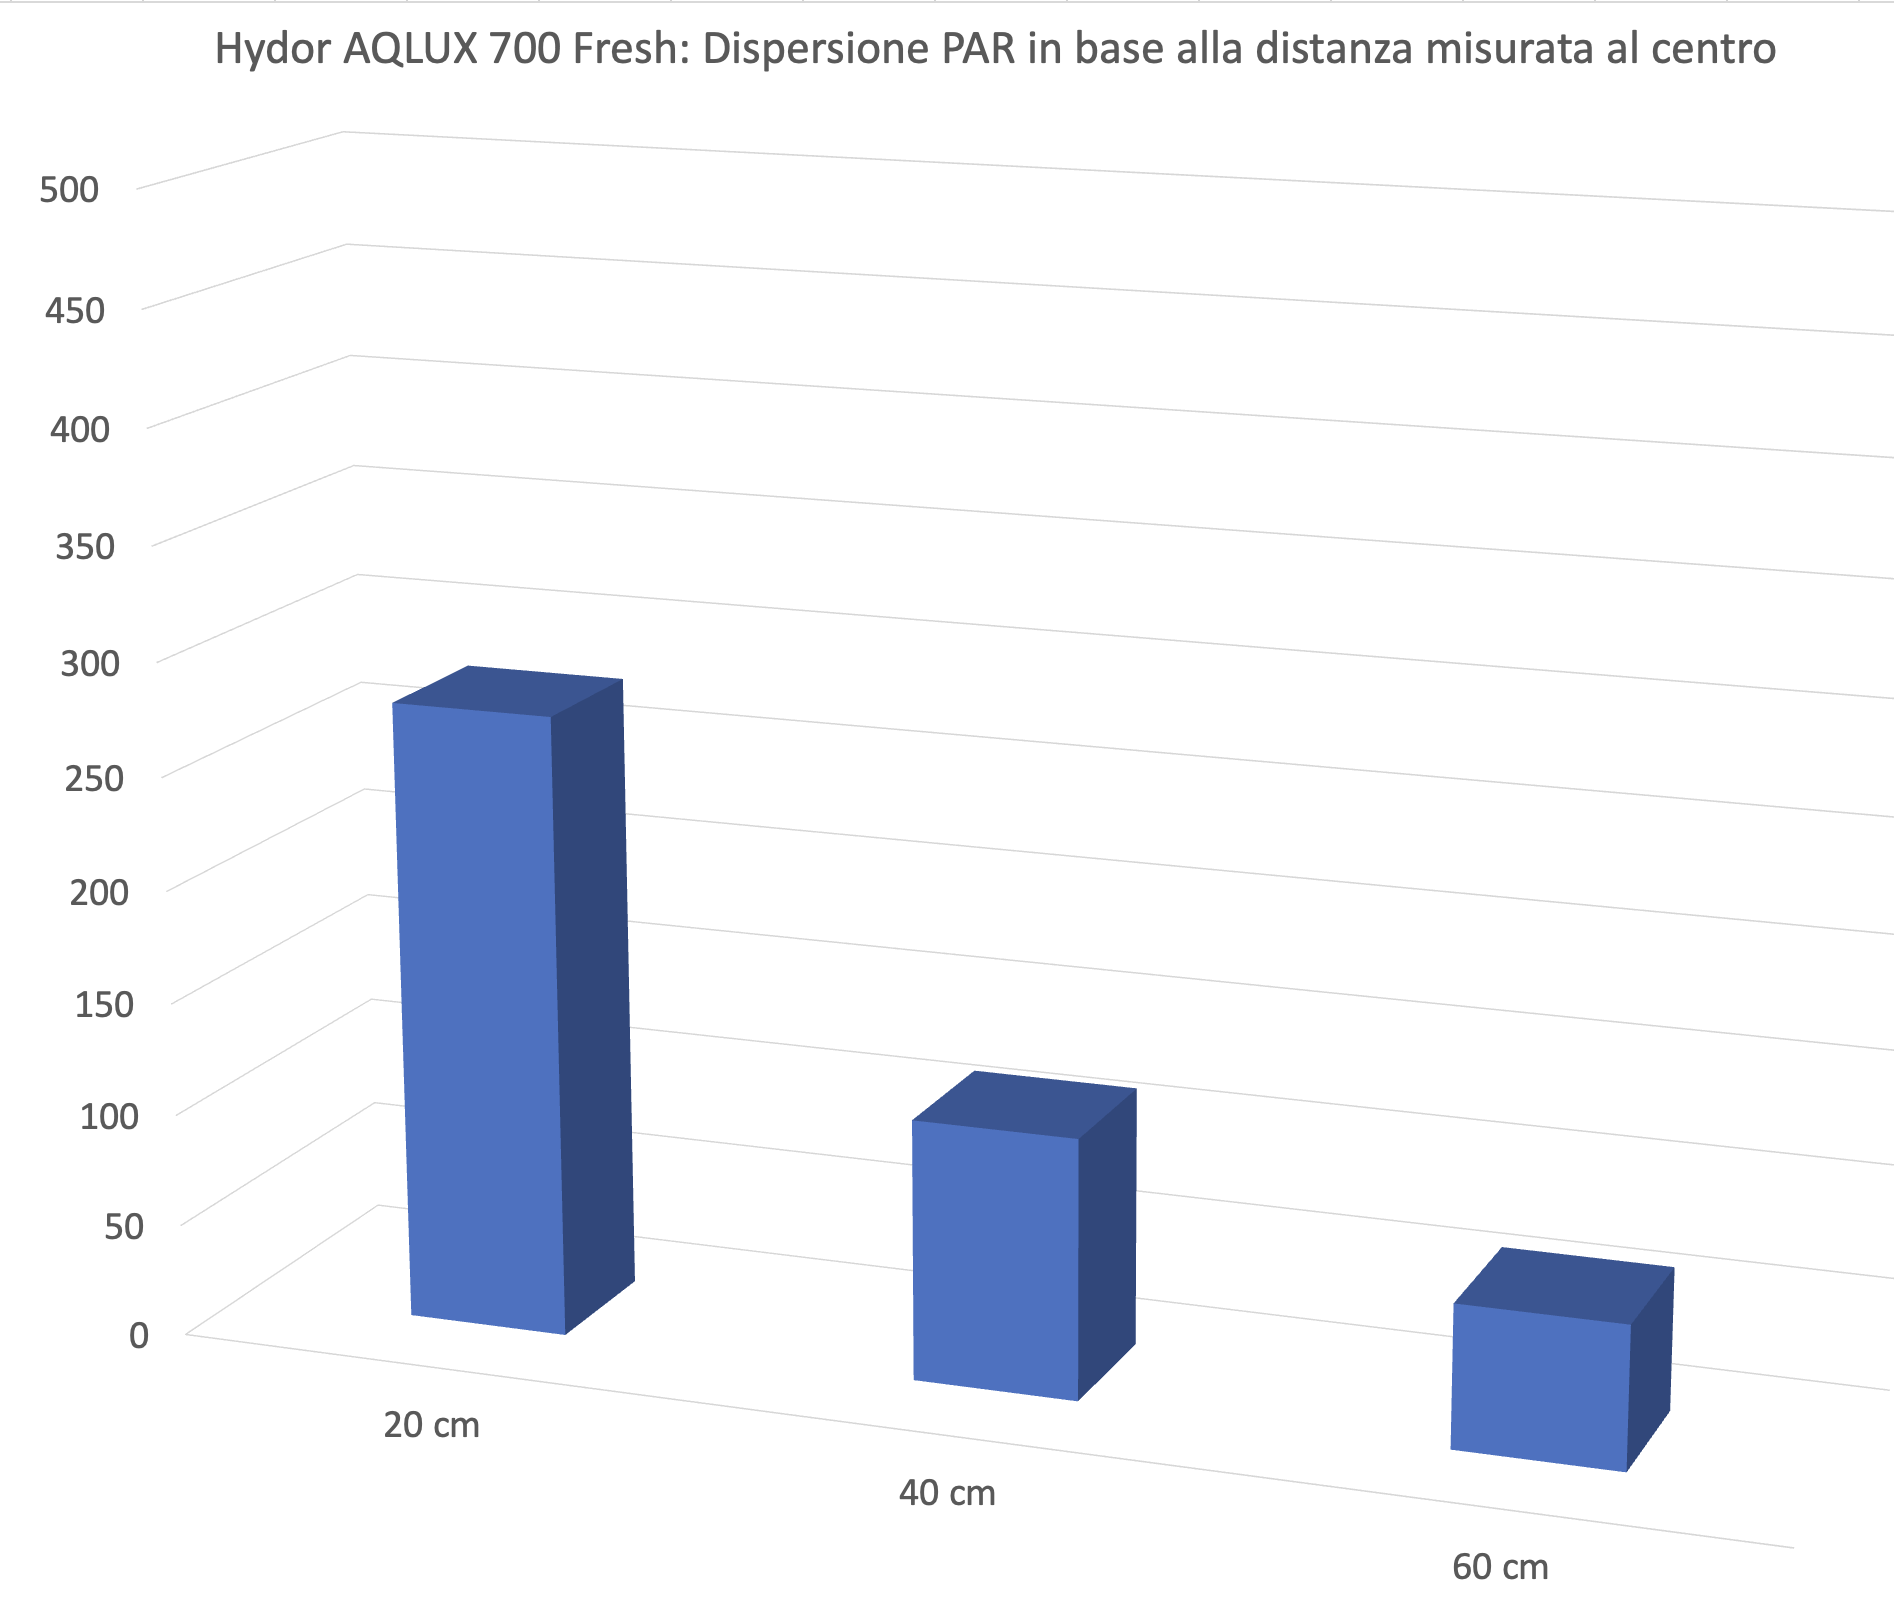
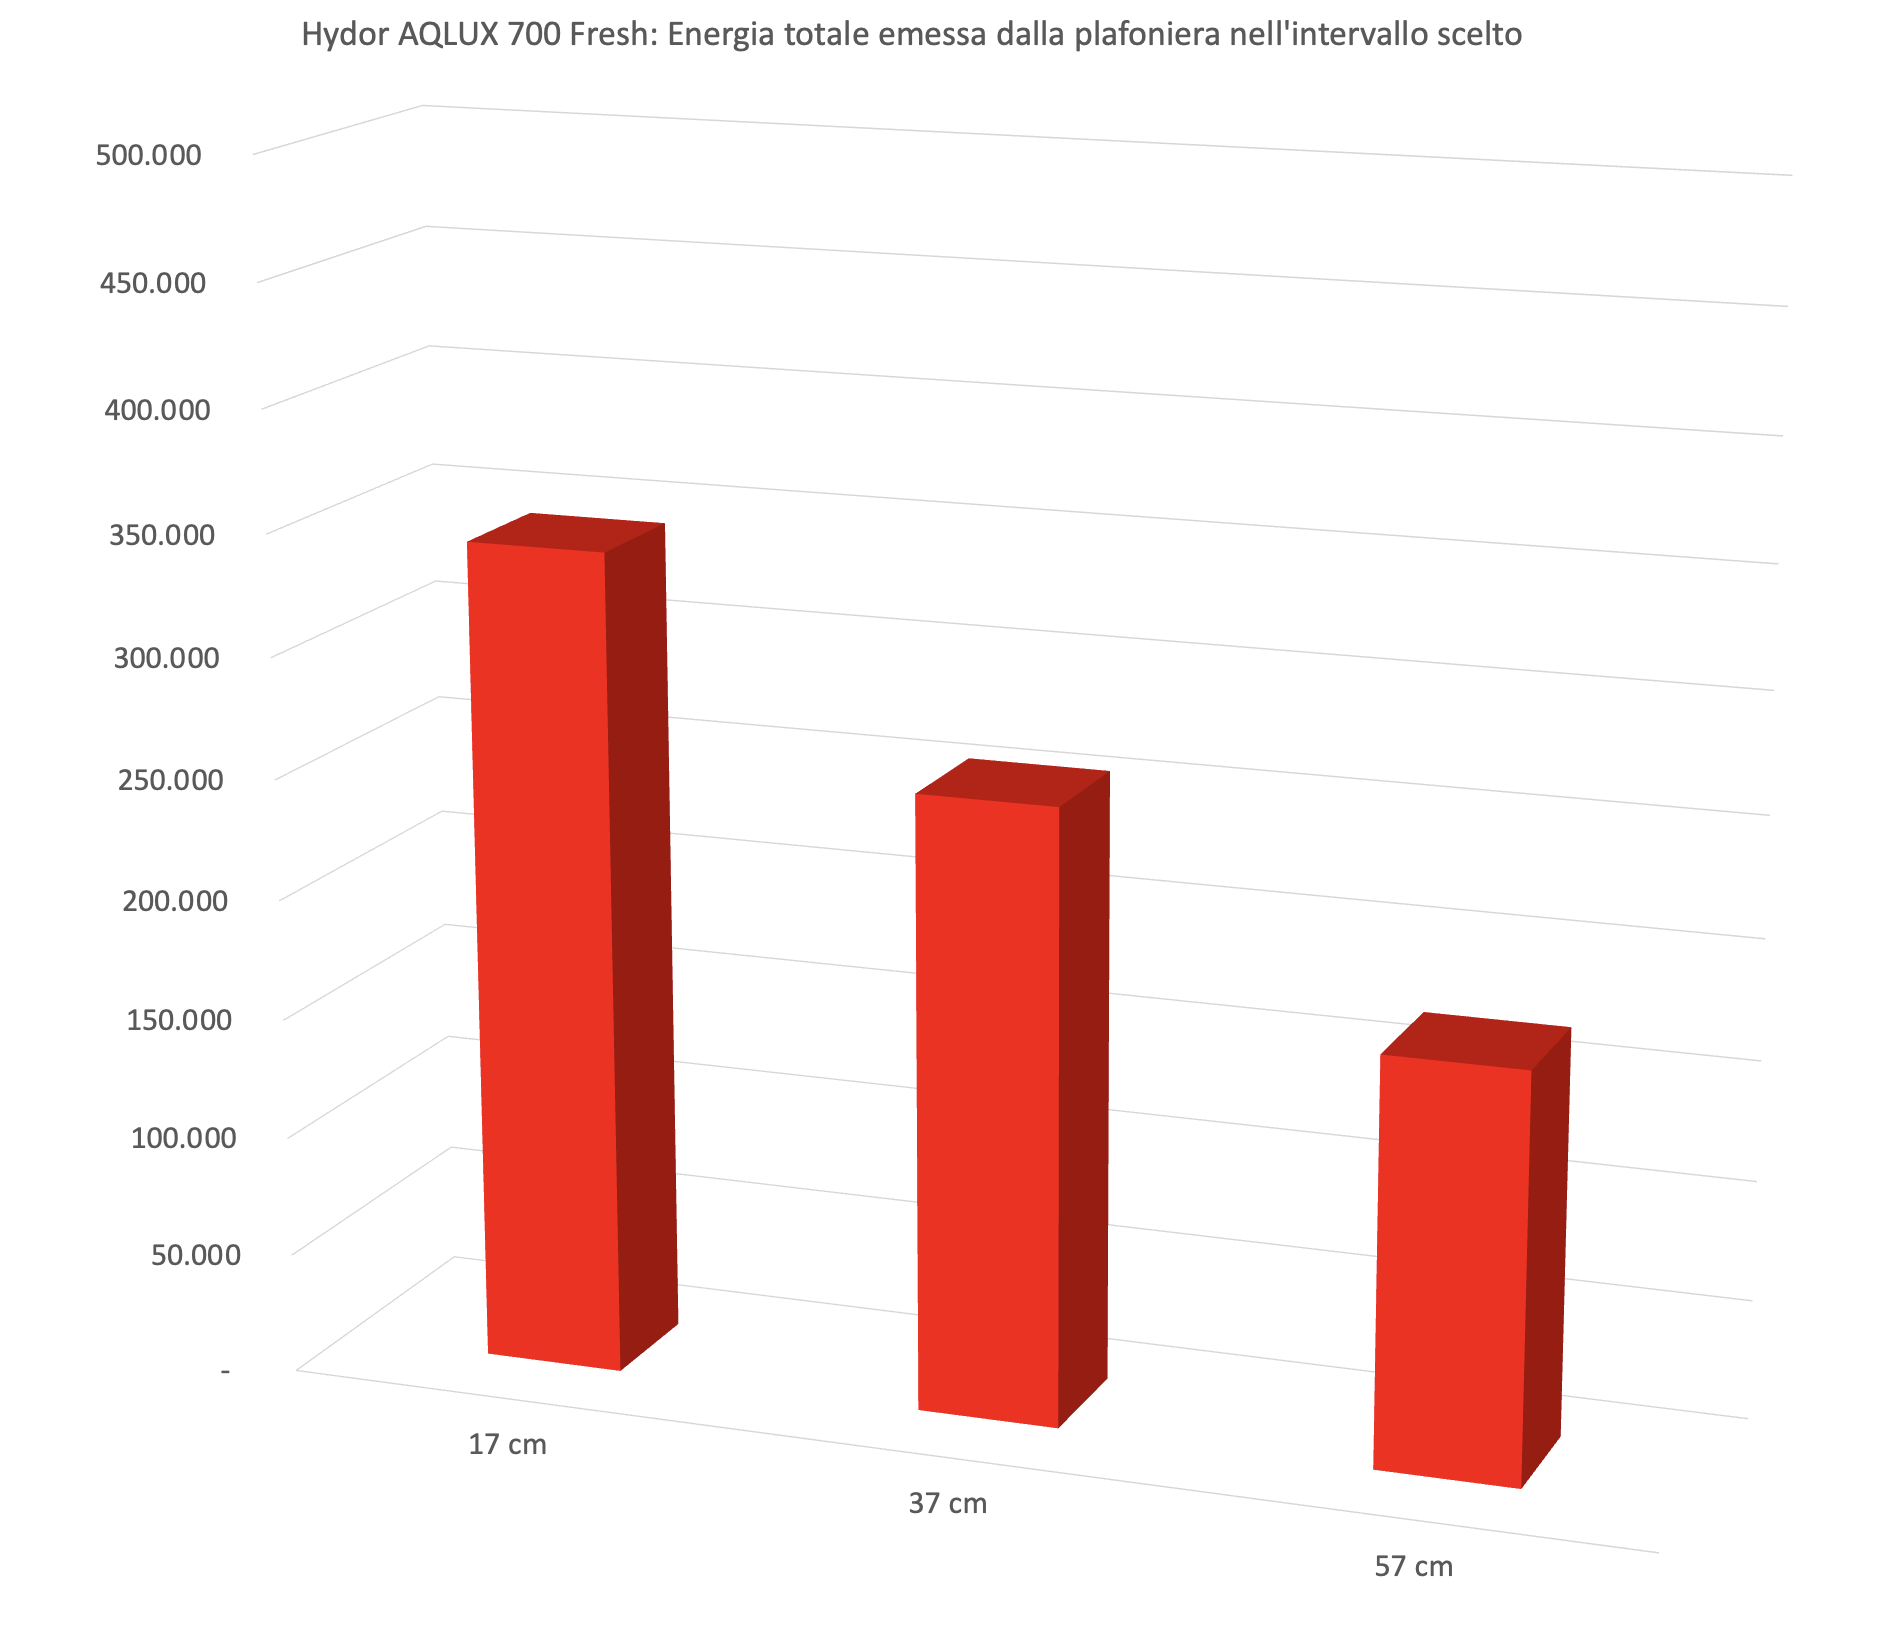
Center PAR drops markedly between 17 and 37 cm, likely due to 120° optics, while total energy decreases far less. Summing total energy at each of the three distances shows that most of the output remains within the aquarium. For comparison with other fixtures, the measured totals are:
- 343,000 µmol m⁻² s⁻¹ total energy at 17 cm.
- 256,000 µmol m⁻² s⁻¹ at 37 cm — about 75% retained.
- 170,000 µmol m⁻² s⁻¹ at 57 cm — about 50% retained.
An extremely meaningful result, showing that Hydor chose the optics well and that this fixture’s design is excellent.
Spectrum and YPF (Yield Photon Flux)
Thanks to the ITC Reefculture PARwise PRO we also measured the emission spectrum and, for the first time here, the important YPF (Yield Photon Flux).
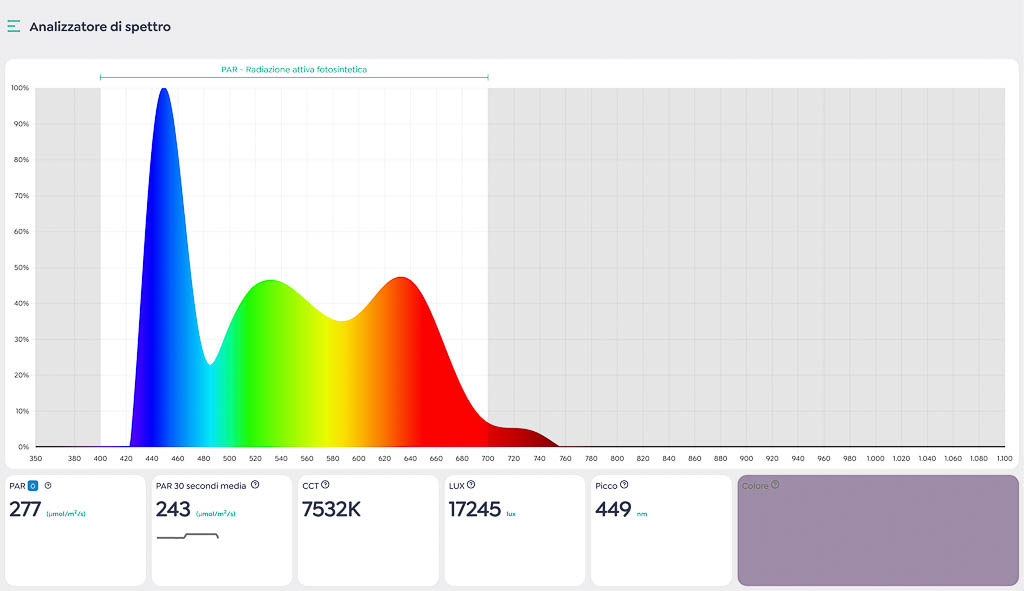
Above is the spectrum as read by the PARwise PRO. The curve is built from discrete points, so it’s not as “perfect” as one from a lab-grade spectrometer, but it clearly shows a dominant region around 449 nm where PAR peaks. It also reports a maximum of 17,245 lux and 243 PAR, measured ~17 cm from the source at the center.
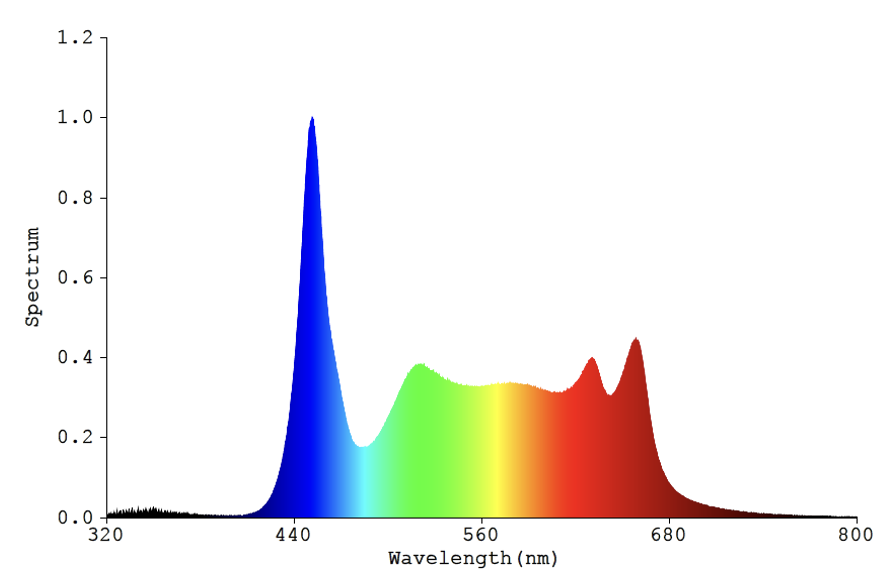
Compared with the manufacturer’s spectrum, the two are very similar, with a clear peak around 440 nm.
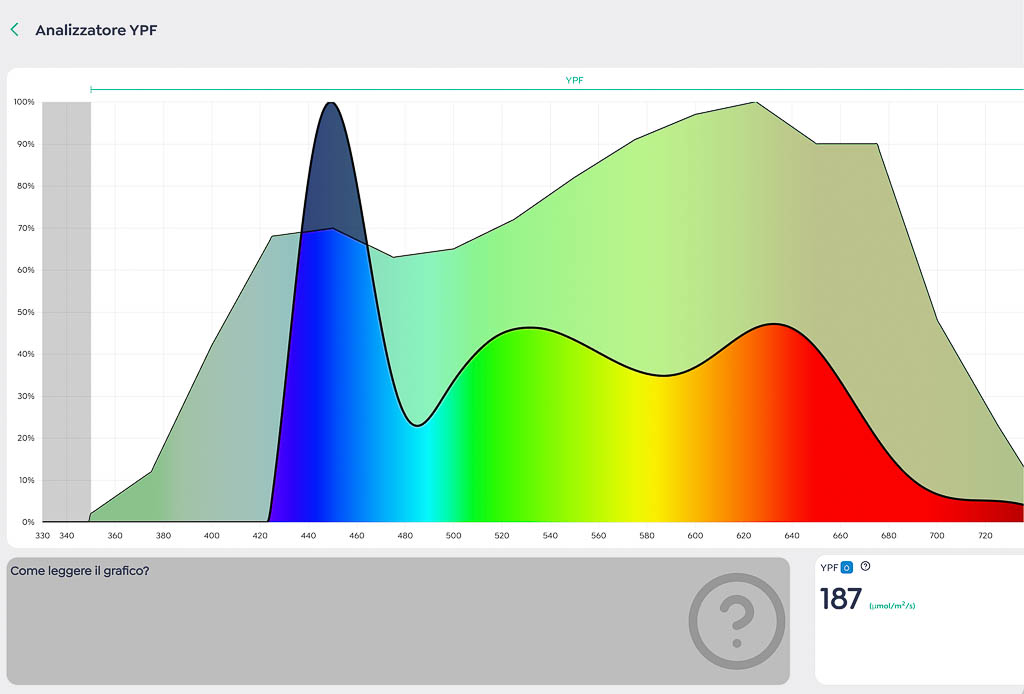
Here the green curve shows the ideal YPF of a “perfect” fixture, while the colored area is our lamp’s emission—i.e., photosynthetically usable radiation. Most of the Hydor AQLUX 700 Fresh spectrum sits below the ideal YPF curve, except for part of the output around 440 nm.
Photosynthetic pigments
To assess a freshwater fixture, it’s important to compare its spectrum with plant pigments. The chart below shows how the Hydor AQLUX 700 Fresh covers the main absorption bands of Chlorophyll A and B, essential for photosynthesis, and of accessory pigments like Carotenoids, Fucoxanthin and Peridinin, which broaden the usable spectrum.
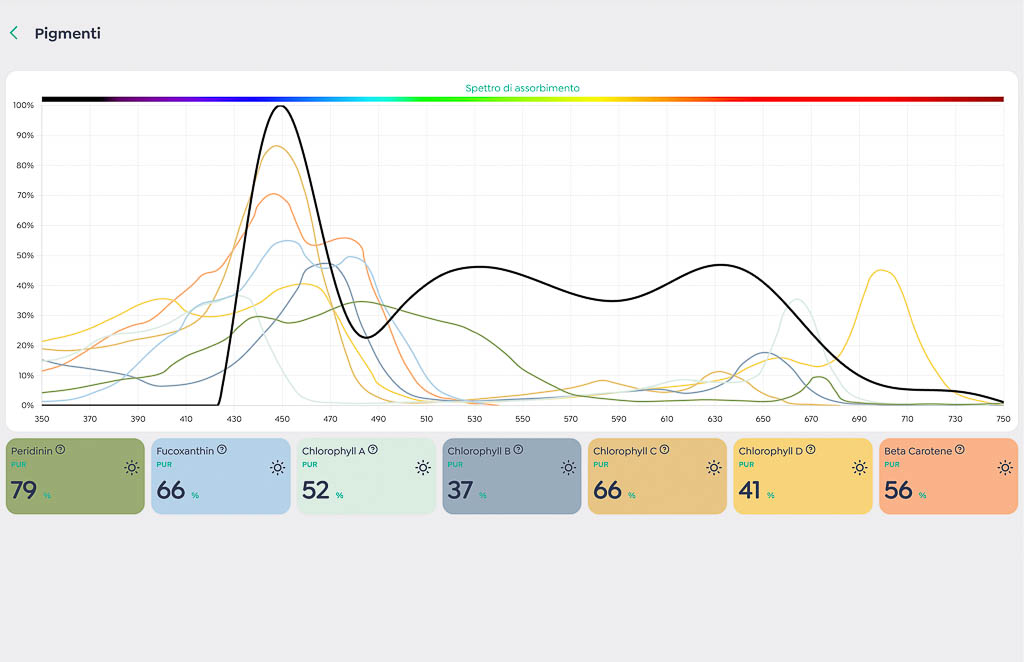
There’s a strong blue peak (~430–460 nm), very effective for primary photosynthesis, and broad red coverage (~650–670 nm), crucial for growth and biomass production. The PAR-related efficiencies we observed: Peridinin up to 79%, Fucoxanthin and Chlorophyll C at 66%, while Chlorophyll A and Beta Carotene sit at 52% and 56%, respectively.
This distribution makes the Hydor AQLUX 700 Fresh a well-balanced fixture, able to deliver the radiation aquatic plants need for healthy growth, strong coloration and a complete photosynthetic metabolism.
How should we read these numbers in a tank?
Great question. At first we thought we could simply transpose the numbers to an actual aquarium. Then we filled a tank, immersed the probe, and repeated some measurements—initially puzzling results. At ~20 cm the readings are nearly identical, but deeper down, due to glass reflections and water scattering, values can be up to twice the ones measured in air. Since this isn’t easily standardized, we believe our current methodology remains the best to compare coverage among different fixtures.
Power consumption of the Hydor AQLUX 700 Fresh
Instant consumption was measured with the handy RCE PM600, which can also read power factor (cos φ). The result is provided directly in watts.
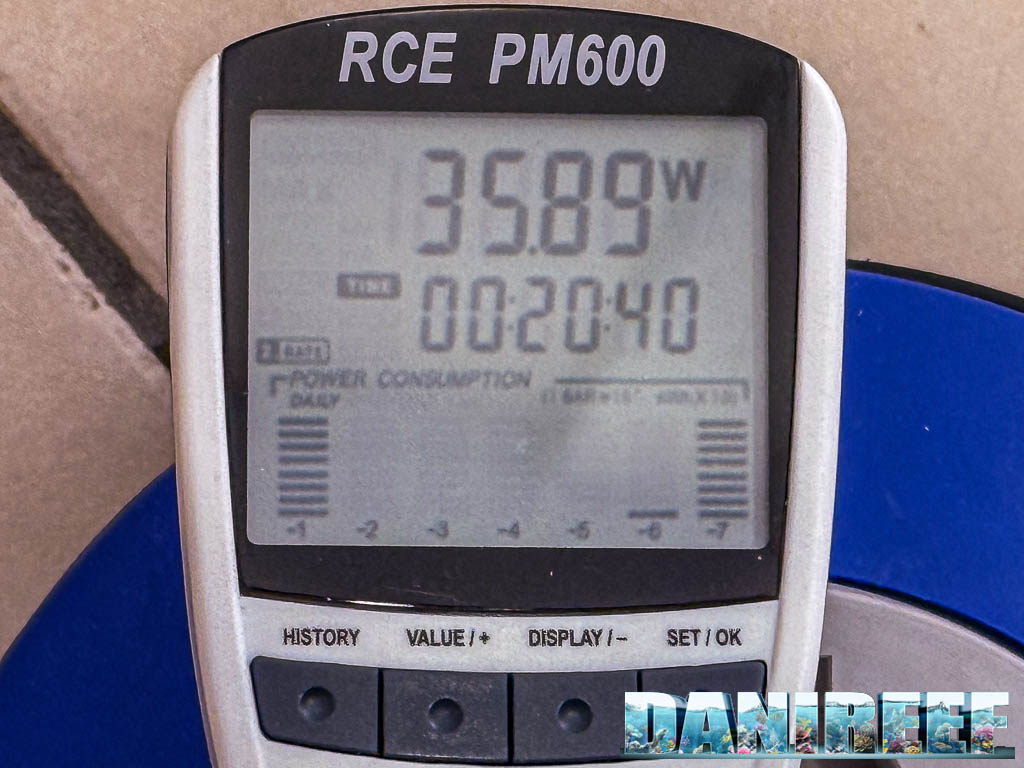
The Hydor AQLUX 700 Fresh draws 35.89 watts, practically identical to the stated 36 W. Considering we measured 277 μmol m⁻² s⁻¹ at 17 cm in the center, the peak efficacy is about 7.72 μmol m⁻² s⁻¹ W⁻¹ (PAR per watt). It’s not straightforward to compare with a classic fixture since output is more uniform along the bar’s length, but this is one of the highest freshwater values we’ve recorded.
The Hydor AQLUX 700 Fresh LED bars retail for €99.90 on Hydor and Ferplast, plus the small 36 W power supply at €26.90, for a total of €126.80. The Ferplast site currently offers a 5% discount promotion to consider. With a measured draw of 35.89 W, that’s €3.53 per watt.
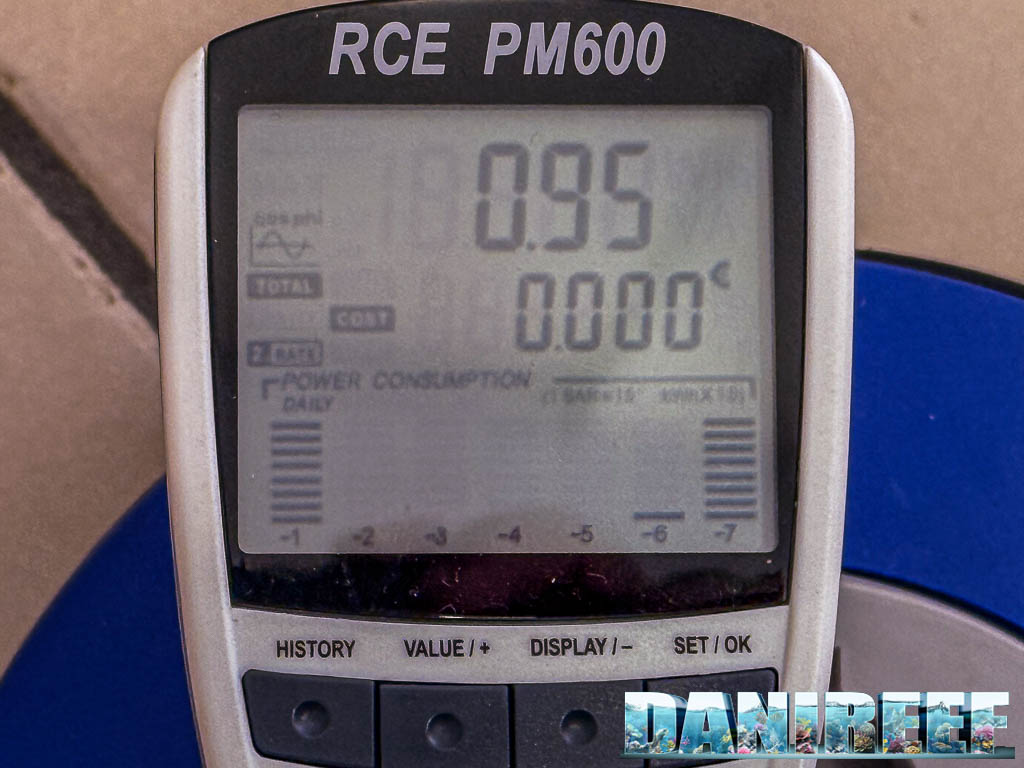
Power factor is 0.95, an excellent figure—well above the average we’ve seen in the past. Rarely have we found lighting systems this well corrected. Kudos to Hydor for this as well.
Which plants suit this light?
Now that we’ve seen the Hydor AQLUX 700 Fresh PAR output, let’s identify which plants it suits. It’s certainly perfect for a community tank where plants aren’t the main focus, but let’s reason through plant PAR needs.
We used a table from Seneye listing PAR requirements by plant type. You can find it on this page, and we’ve reproduced it below for clarity. In our table you can also search plants and see minimum, ideal, and maximum PAR values for each.
| Genus | Species | Lighting Requirement |
PAR Min |
PAR Ideal |
PAR Max |
|---|---|---|---|---|---|
| Anubias | angustifolia | — | 40 | 125 | 200 |
| Anubias | barteri | — | 40 | 75 | 125 |
| Anubias | nana | — | 40 | 75 | 125 |
| Anubias | Species | — | 40 | 100 | 200 |
| Aponogeton | Species | High | 100 | 150 | 200 |
| Bacopa | monnieri | — | 100 | 175 | 250 |
| Bacopa | Species | — | 100 | 175 | 250 |
| Cabomba | caroliniana | Medium | 100 | 150 | 200 |
| Cabomba | Species | High | 100 | 150 | 250 |
| Crinum | Species | High | 100 | 150 | 200 |
| Cryptocoryne | beckettii | — | 50 | 125 | 200 |
| Cryptocoryne | wendtii | — | 50 | 125 | 200 |
| Cryptocorynes | Species | Low | 40 | 50 | 200 |
| Echinodorus | barthii | High | 150 | 200 | 250 |
| Echinodorus | bleheri | Low–Very High | 40 | 175 | 250 |
| Echinodorus | macrophyllus | Average to High | 50 | 150 | 200 |
| Echinodorus | osiris | Average to High | 50 | 150 | 200 |
| Echinodorus | Ozelot | — | 50 | 150 | 200 |
| Echinodorus | palaefolius | — | 100 | 200 | 250 |
| Echinodorus | quadricostatus | — | 50 | 150 | 200 |
| Echinodorus | Rose | — | 50 | 100 | 150 |
| Echinodorus | Rubin | — | 50 | 150 | 200 |
| Echinodorus | tenellus | — | 100 | 150 | 200 |
| Echinodorus | uruguayensis | — | 75 | 175 | 250 |
| Echinodorus | Species | Medium | 50 | 100 | 150 |
| Hygrophila | polysperma | — | 150 | 200 | 250 |
| Hygrophila | Species | — | 150 | 200 | 250 |
| Lilaeopsis | Species | High | 100 | 150 | 200 |
| Limnophila | Species | High | 100 | 150 | 200 |
| Ludwigia | Species | High | 100 | 150 | 200 |
| Microsorum | pteropus | — | 40 | 125 | 200 |
| Microsorum | Species | — | 40 | 125 | 200 |
| Myriophyllum | Species | High | 100 | 150 | 200 |
| Nesea | Species | High | 100 | 150 | 200 |
| Nymphaea | Species | High | 100 | 150 | 200 |
| Pogostemon | Species | High | 100 | 150 | 200 |
| Rotala | Species | High | 100 | 150 | 200 |
| Sagittaria | Species | High | 100 | 150 | 200 |
| Vesicularia | dubyana | — | 40 | 125 | 200 |
| Vesicularia | Species | — | 40 | 125 | 200 |
| Vallisneria | americana | — | 50 | 150 | 200 |
| Vallisneria | spiralis | — | 40 | 150 | 200 |
| Egeria | densa | — | 100 | 150 | 250 |
| Egeria | Species | — | 100 | 150 | 250 |
As you saw, at 17 cm—i.e., near the top of a tank—we recorded a peak of 277 μmol m⁻² s⁻¹, enough for virtually any plant. Even at 37 cm—just below mid-depth—we still measured 116 μmol m⁻² s⁻¹ at peak, a nearly ideal value for many species. A single bar may be a bit limiting on the substrate, with 64 μmol m⁻² s⁻¹ peak, though still more than sufficient for all Anubias, for example.
Conclusions
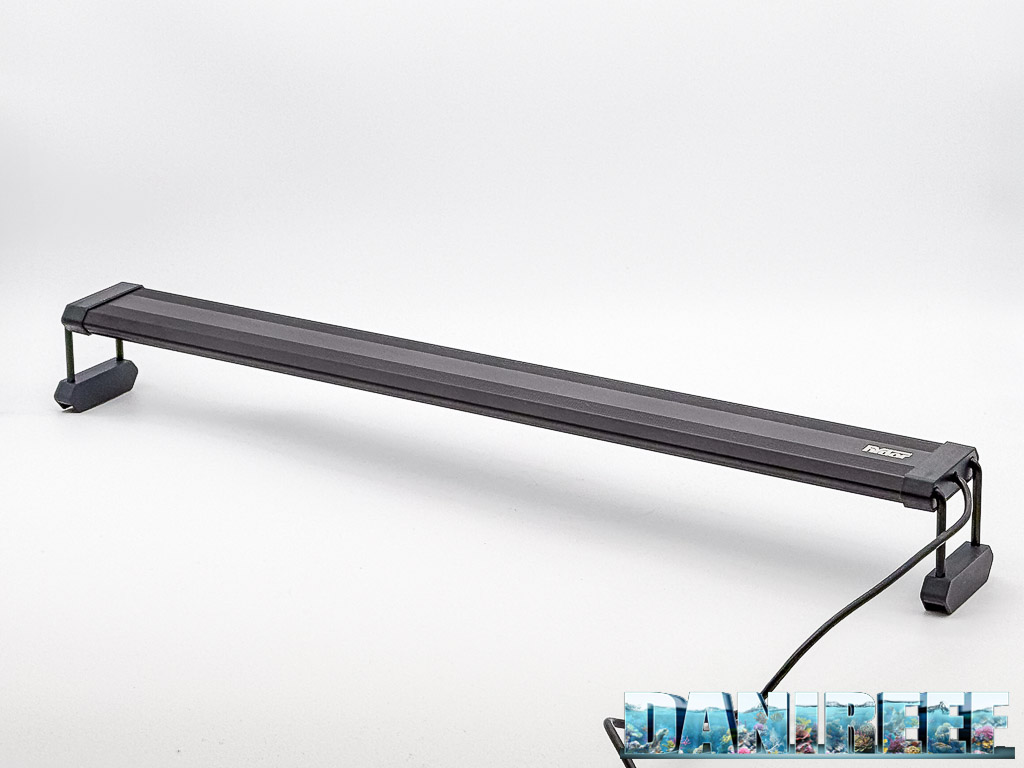
The build quality is excellent, with the added bonus of IP67 certification. Technical efficiency (PAR per watt) is very high, and cost per PAR is competitive. The measured PAR values allow any plant in the upper part of the aquarium; deeper in the column, intensity drops and may be insufficient for very demanding, high-light species. With that in mind, for about €120 you get a fixture that can run a 70 cm freshwater tank while giving up very little.
I really like the extruded profiles and finish, and the adjustable brackets are very practical for different tank lengths. The simple integrated controller provides everything you need, while still leaving the door open for a more advanced controller that Hydor should release in the near future.
Have you already tried the new Hydor AQLUX bars on your tank? Share your experience in the comments or on our DaniReef Forum. Don’t miss our upcoming articles, reviews and reports: follow us on Facebook, Instagram, YouTube, TikTok, Telegram, X/Twitter and LinkedIn.
Transparency Disclaimer: This article is based on instrumented tests carried out in the DaniReef LAB (PAR/PPFD, coverage maps, power draw and cos φ). The Hydor AQLUX 700 Fresh sample was provided by Ferplast/Hydor for testing; no compensation was paid and Ferplast/Hydor did not review or approve the text prior to publication. Conclusions reflect only the data collected and the author’s experience. Some links may be affiliate links: if you purchase through them, DaniReef may receive a small commission at no extra cost to you.
Scopri di più da DaniReef - Portale dedicato a Acquario Marino e Dolce
Abbonati per ricevere gli ultimi articoli inviati alla tua e-mail.


