

Our new DaniReef LAB working method for PAR measurement
During the long nights spent on our forum (here) we always wondered how could we compare PAR from different ceiling lights. Even though we had the perfect device, the Quantum Meter MQ-510 di Apogee, we always referred only to the value measured at the centre at 20 cm of distance, more or less.
IThe Quantum Meter MQ-510 measures the PAR, expressed in PFFD that is photosynthetic photon flux density in μmol m-2 s-1. This device is calibrated to work underwater, so if it’s in air the measured value has to be divided by 1,32 that’s the dive factor. We have to do the conversion. The values you’re going to see are correct.

We decided to make a square base of 70×70 cm, we set 17 fiducial points where we placed the sensor Quantum Meter MQ-510 and we also made 3 lifts of 20, 40 and 60 cm for the ceiling light, in order to have the same distance from the sensor. This will allow us to create the curves which can be compared to other ceiling lights’s, all tested at the same distances. Notice that this distance is measured between the base of the sensor and the ceiling light. In reality it should be decreased of 3,5 cm that is the height of the measurement cylinder and increased by 0,5 cm that’s the dimension of the spacers that lift the ceiling light.
So the three measurements are made from 17, 37 and 57 cm of distance. Because they’ve been done in air, they will be corrected.
PAR measurement from 17 cm of distance
Here the collected values:

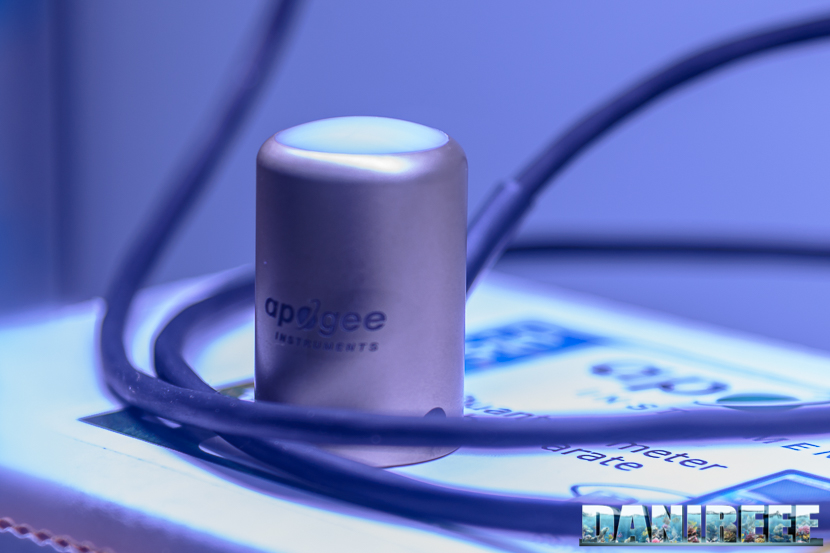
And this is the corresponding chart. We are using the same scale for ceiling lights of the same class. In this case, speaking of bars, we lowered the maximum scale. For the bars we’ll test in the future, you’ll find the same evaluation scale.
As you can see the bar creates a curve similar to a tent, with the spacial differences due to the kind of LED used. Differently from classic lamps the decrease is very linear, at 20 cm from the light source. Notice that on the left of the chart the LED give back a higher value of PAR. This happens probably because of their distribution. The decay on the sides depends on the length of the bar, that’s 60 cm only.
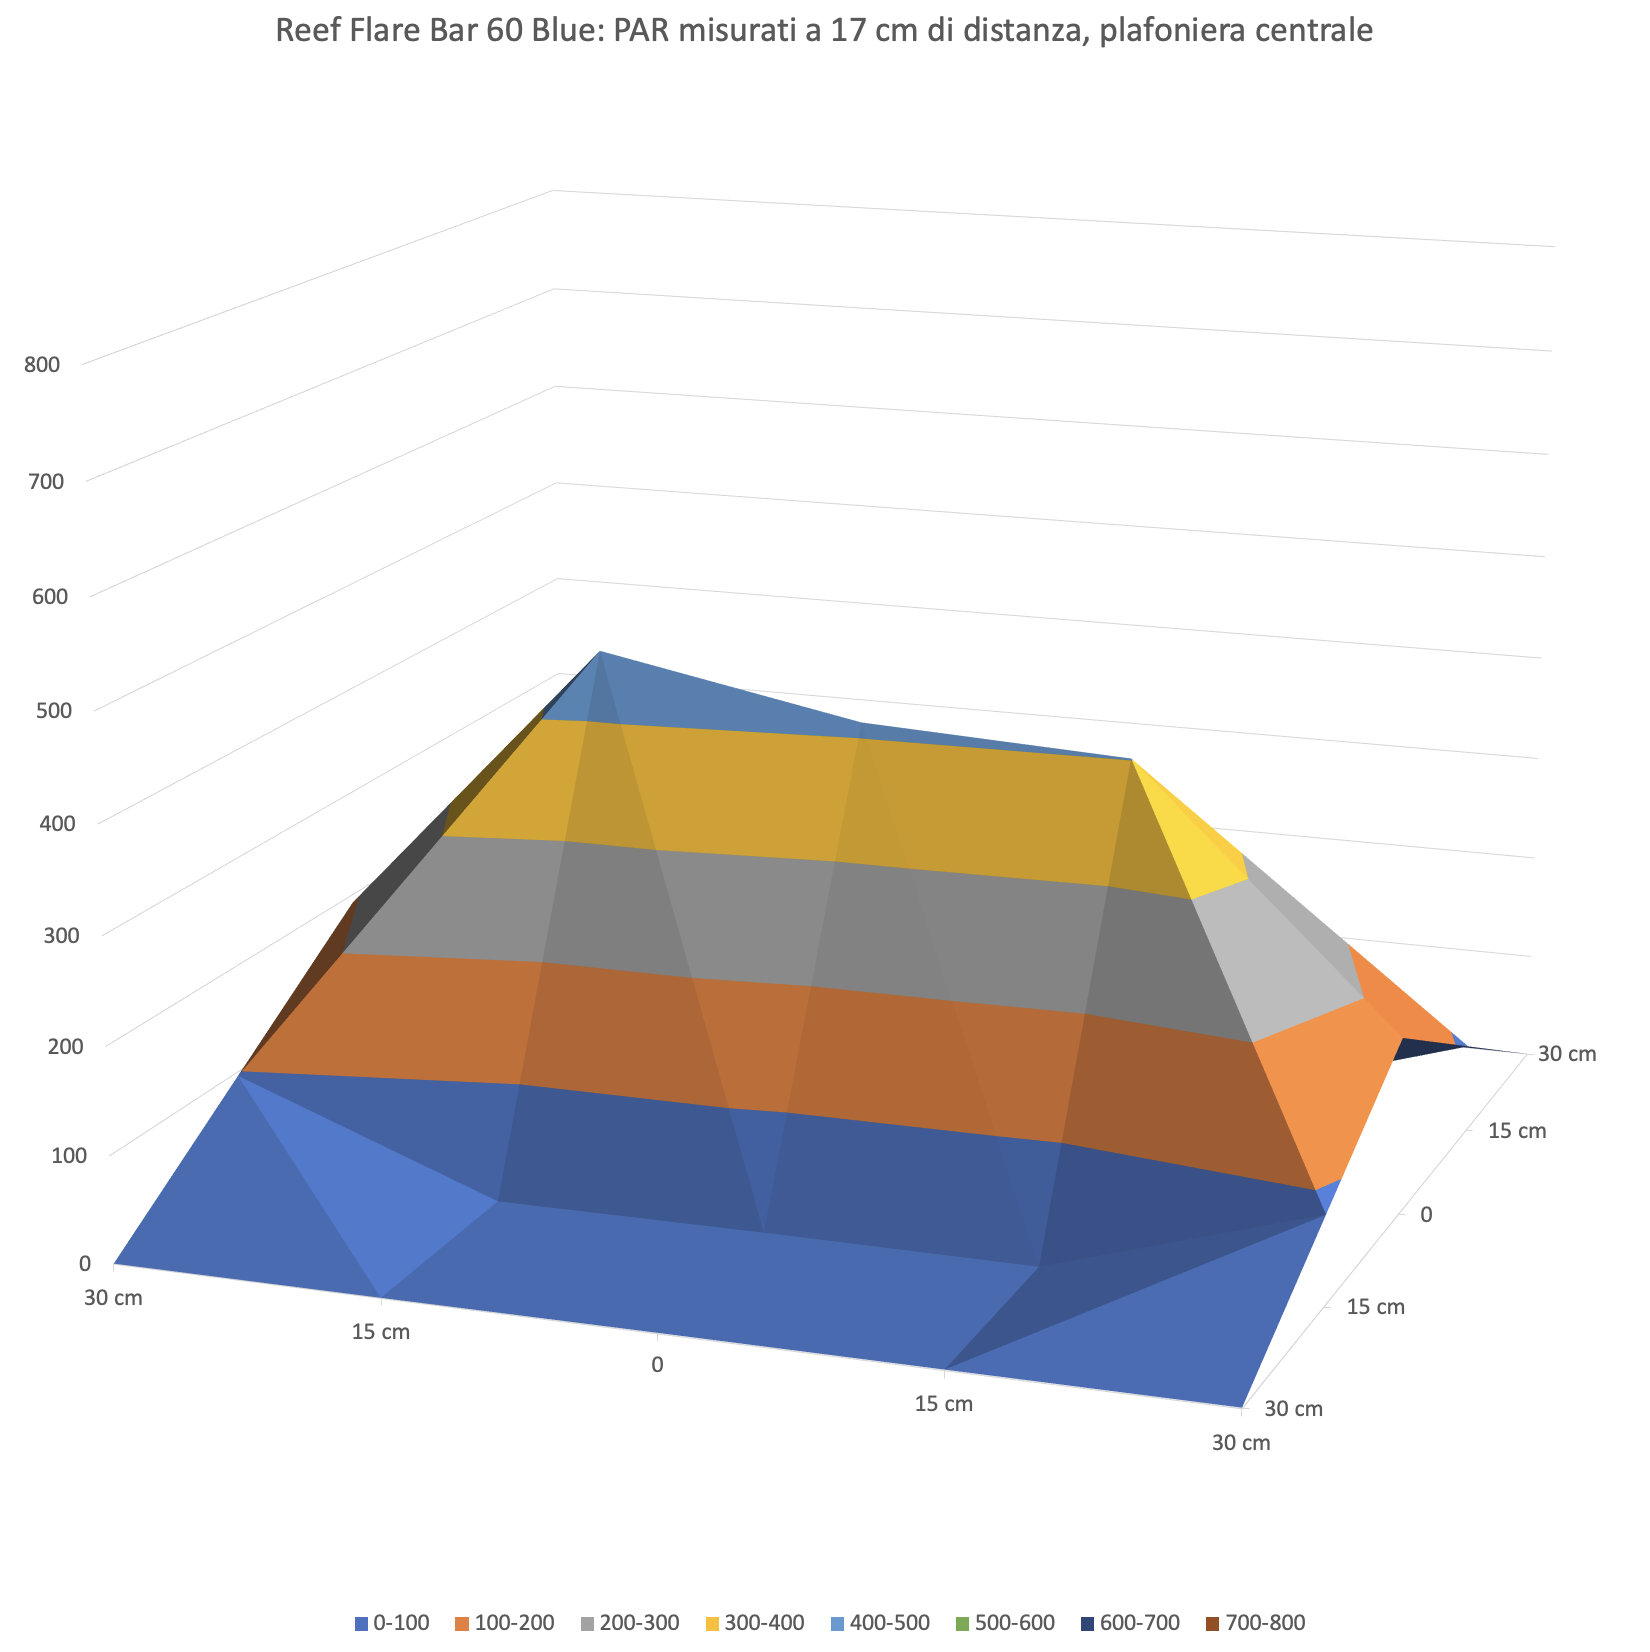
Let’s see the differences with the graphs of the LED blue bars. Remember that the scale is the same.

As you can see, the behavior is similar, with the Blue Sky that has a peak of PAR slightly better than the Blue Plus. The graph is more linear only because the bar is longer.
PAR measurement from 37 cm of distance
Here the collected values:

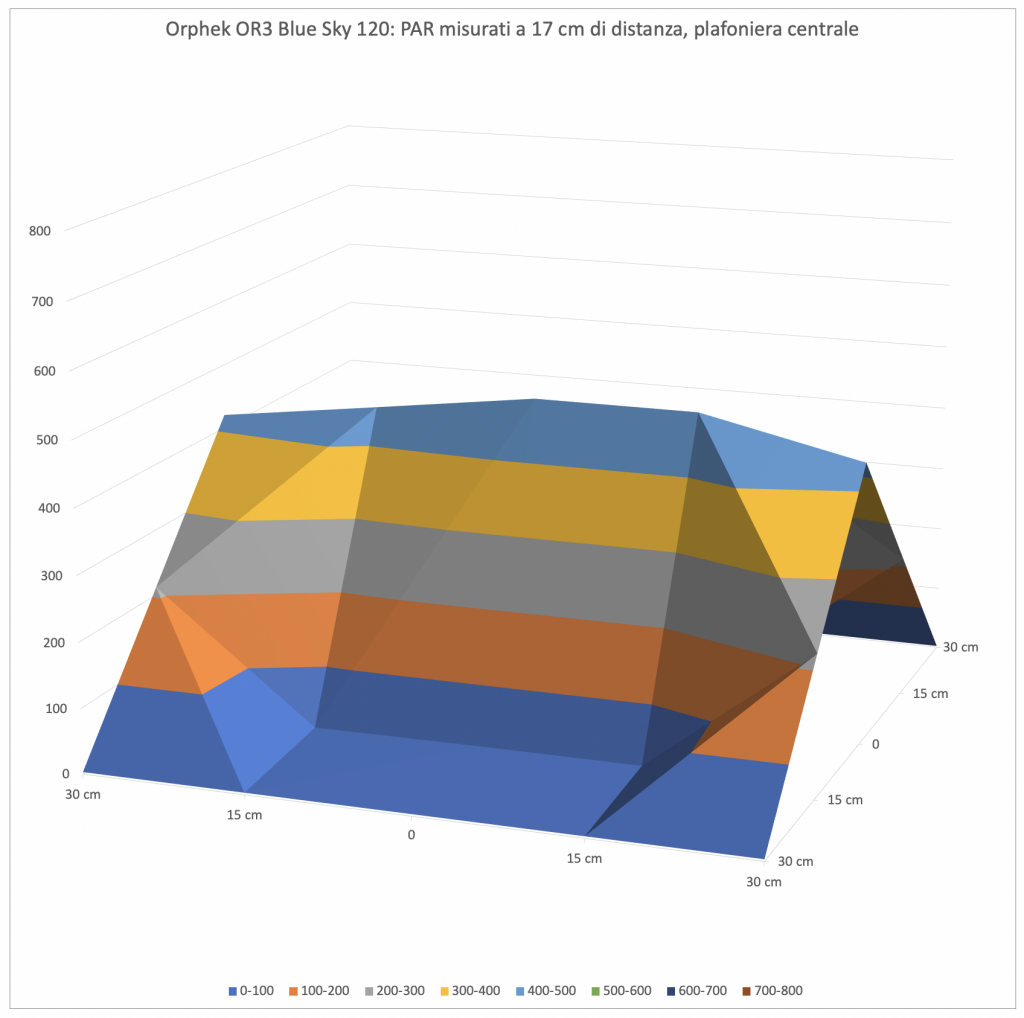
And this is the corresponding graph.
With a bigger space between ceiling light and sensor, the difference between PAR at the middle and on the sides decreases. The light spreads a lot, but the value at the middle decreases from 459 to 189 μmol m-2 s-1, measured in the brightest points. Here also the part on the left is slightly brighter.
It stands out that the coverage is fuller.
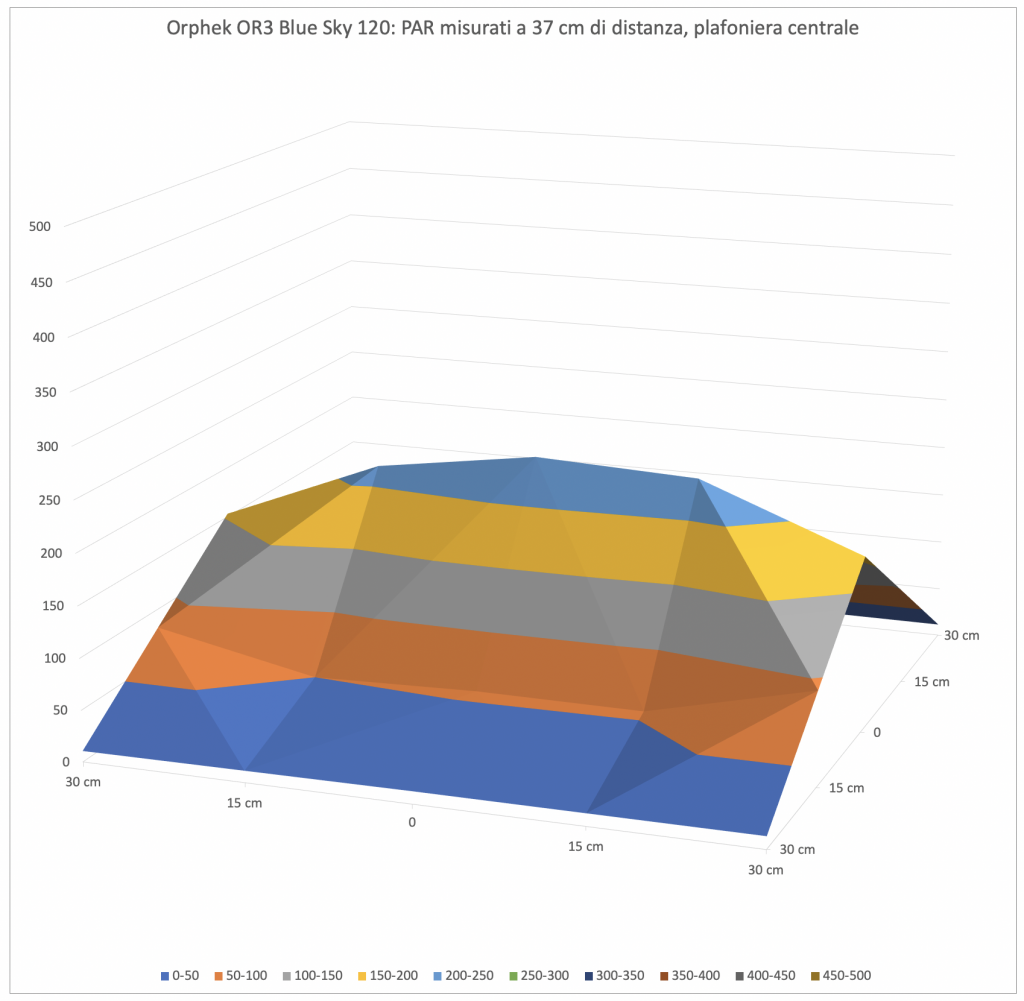

The previous considerations also apply to this configuration. The result is more similar to the Orphek Blue Plus bars, because they have very similar LED, therefore they’re more comparable.
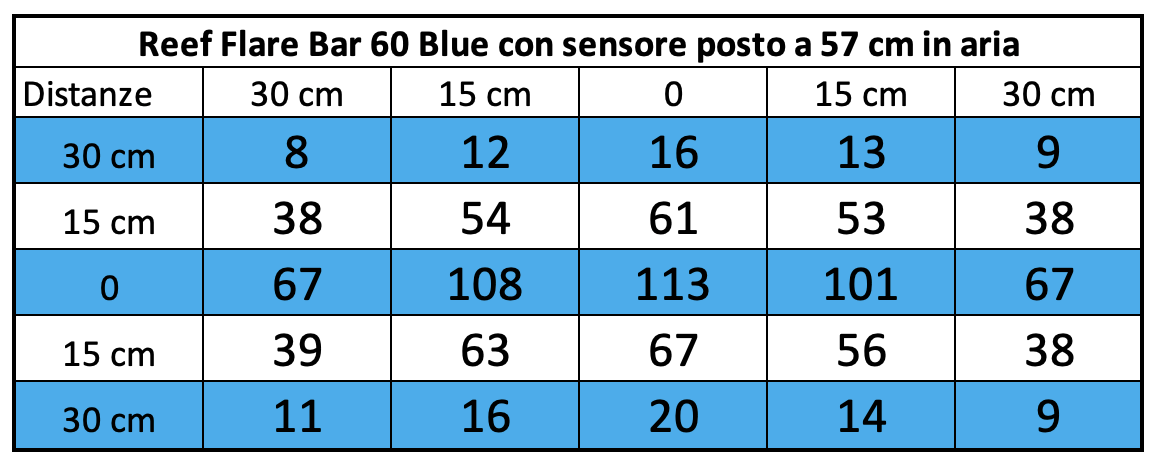
PAR measurement from 57 cm of distance
These are the collected values:
And this is the corresponding chart:
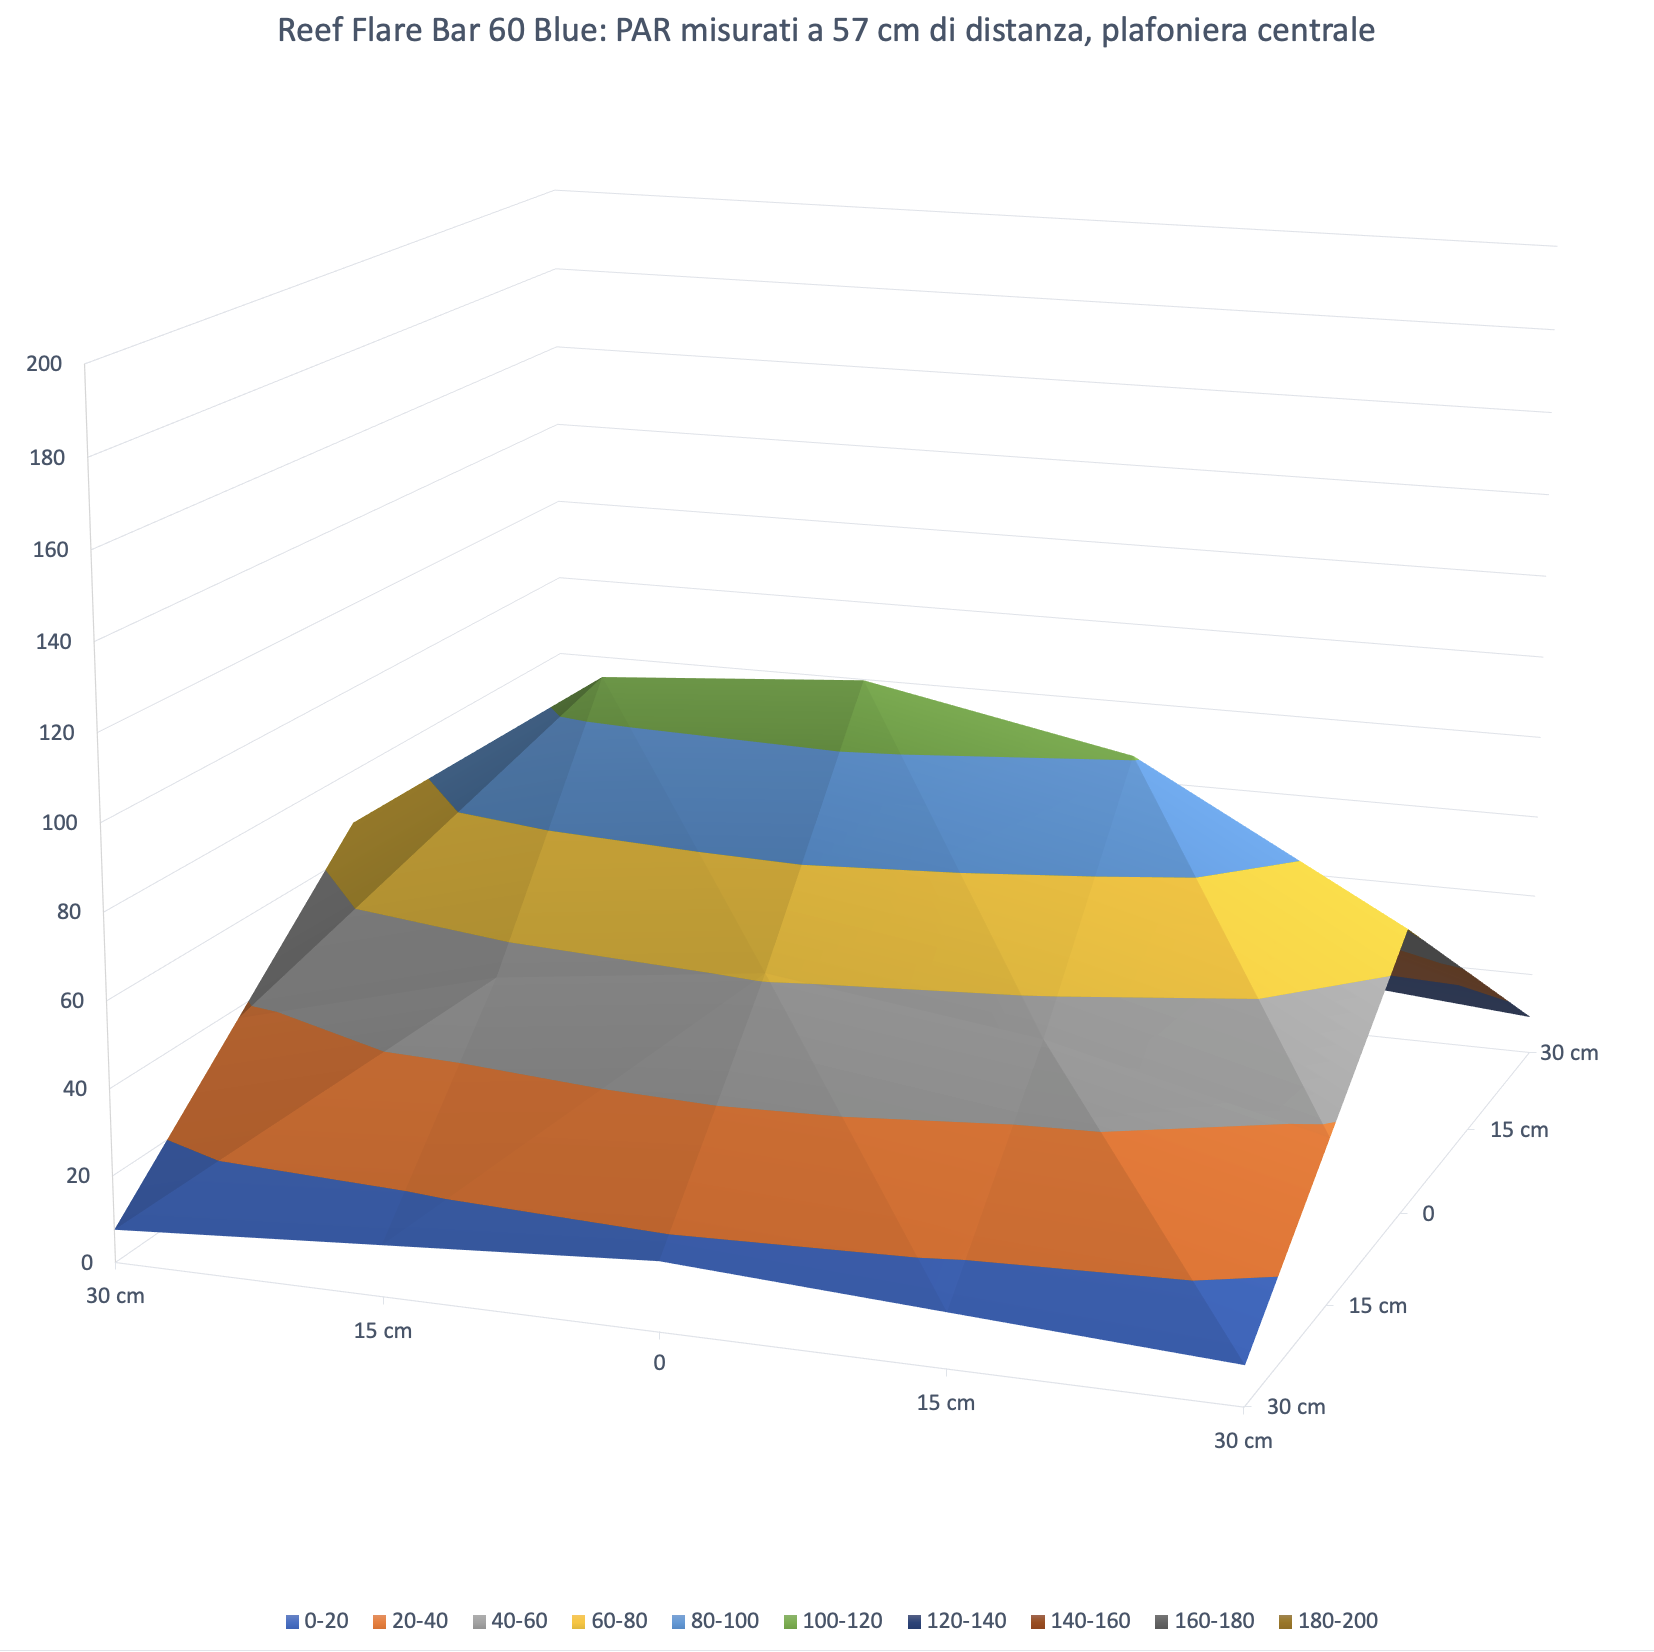
Increasing even more the space between ceiling light and sensor also increases the uniformity among the collected values. The uniformity is practically perfect. The value at the middle decreases again from 459 to 189 to 113 μmol m-2 s-1.
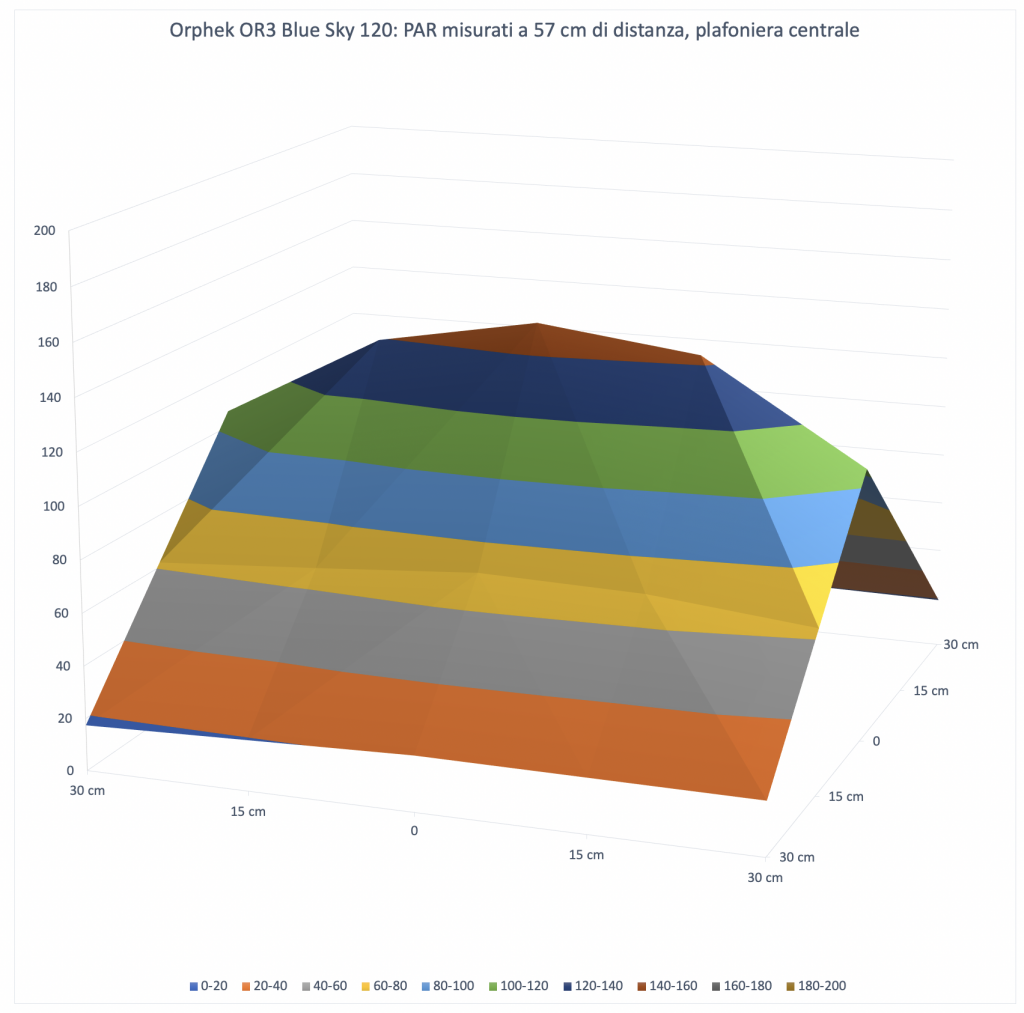

The difference with other ceiling lights is still the same, as in the previous configurations.
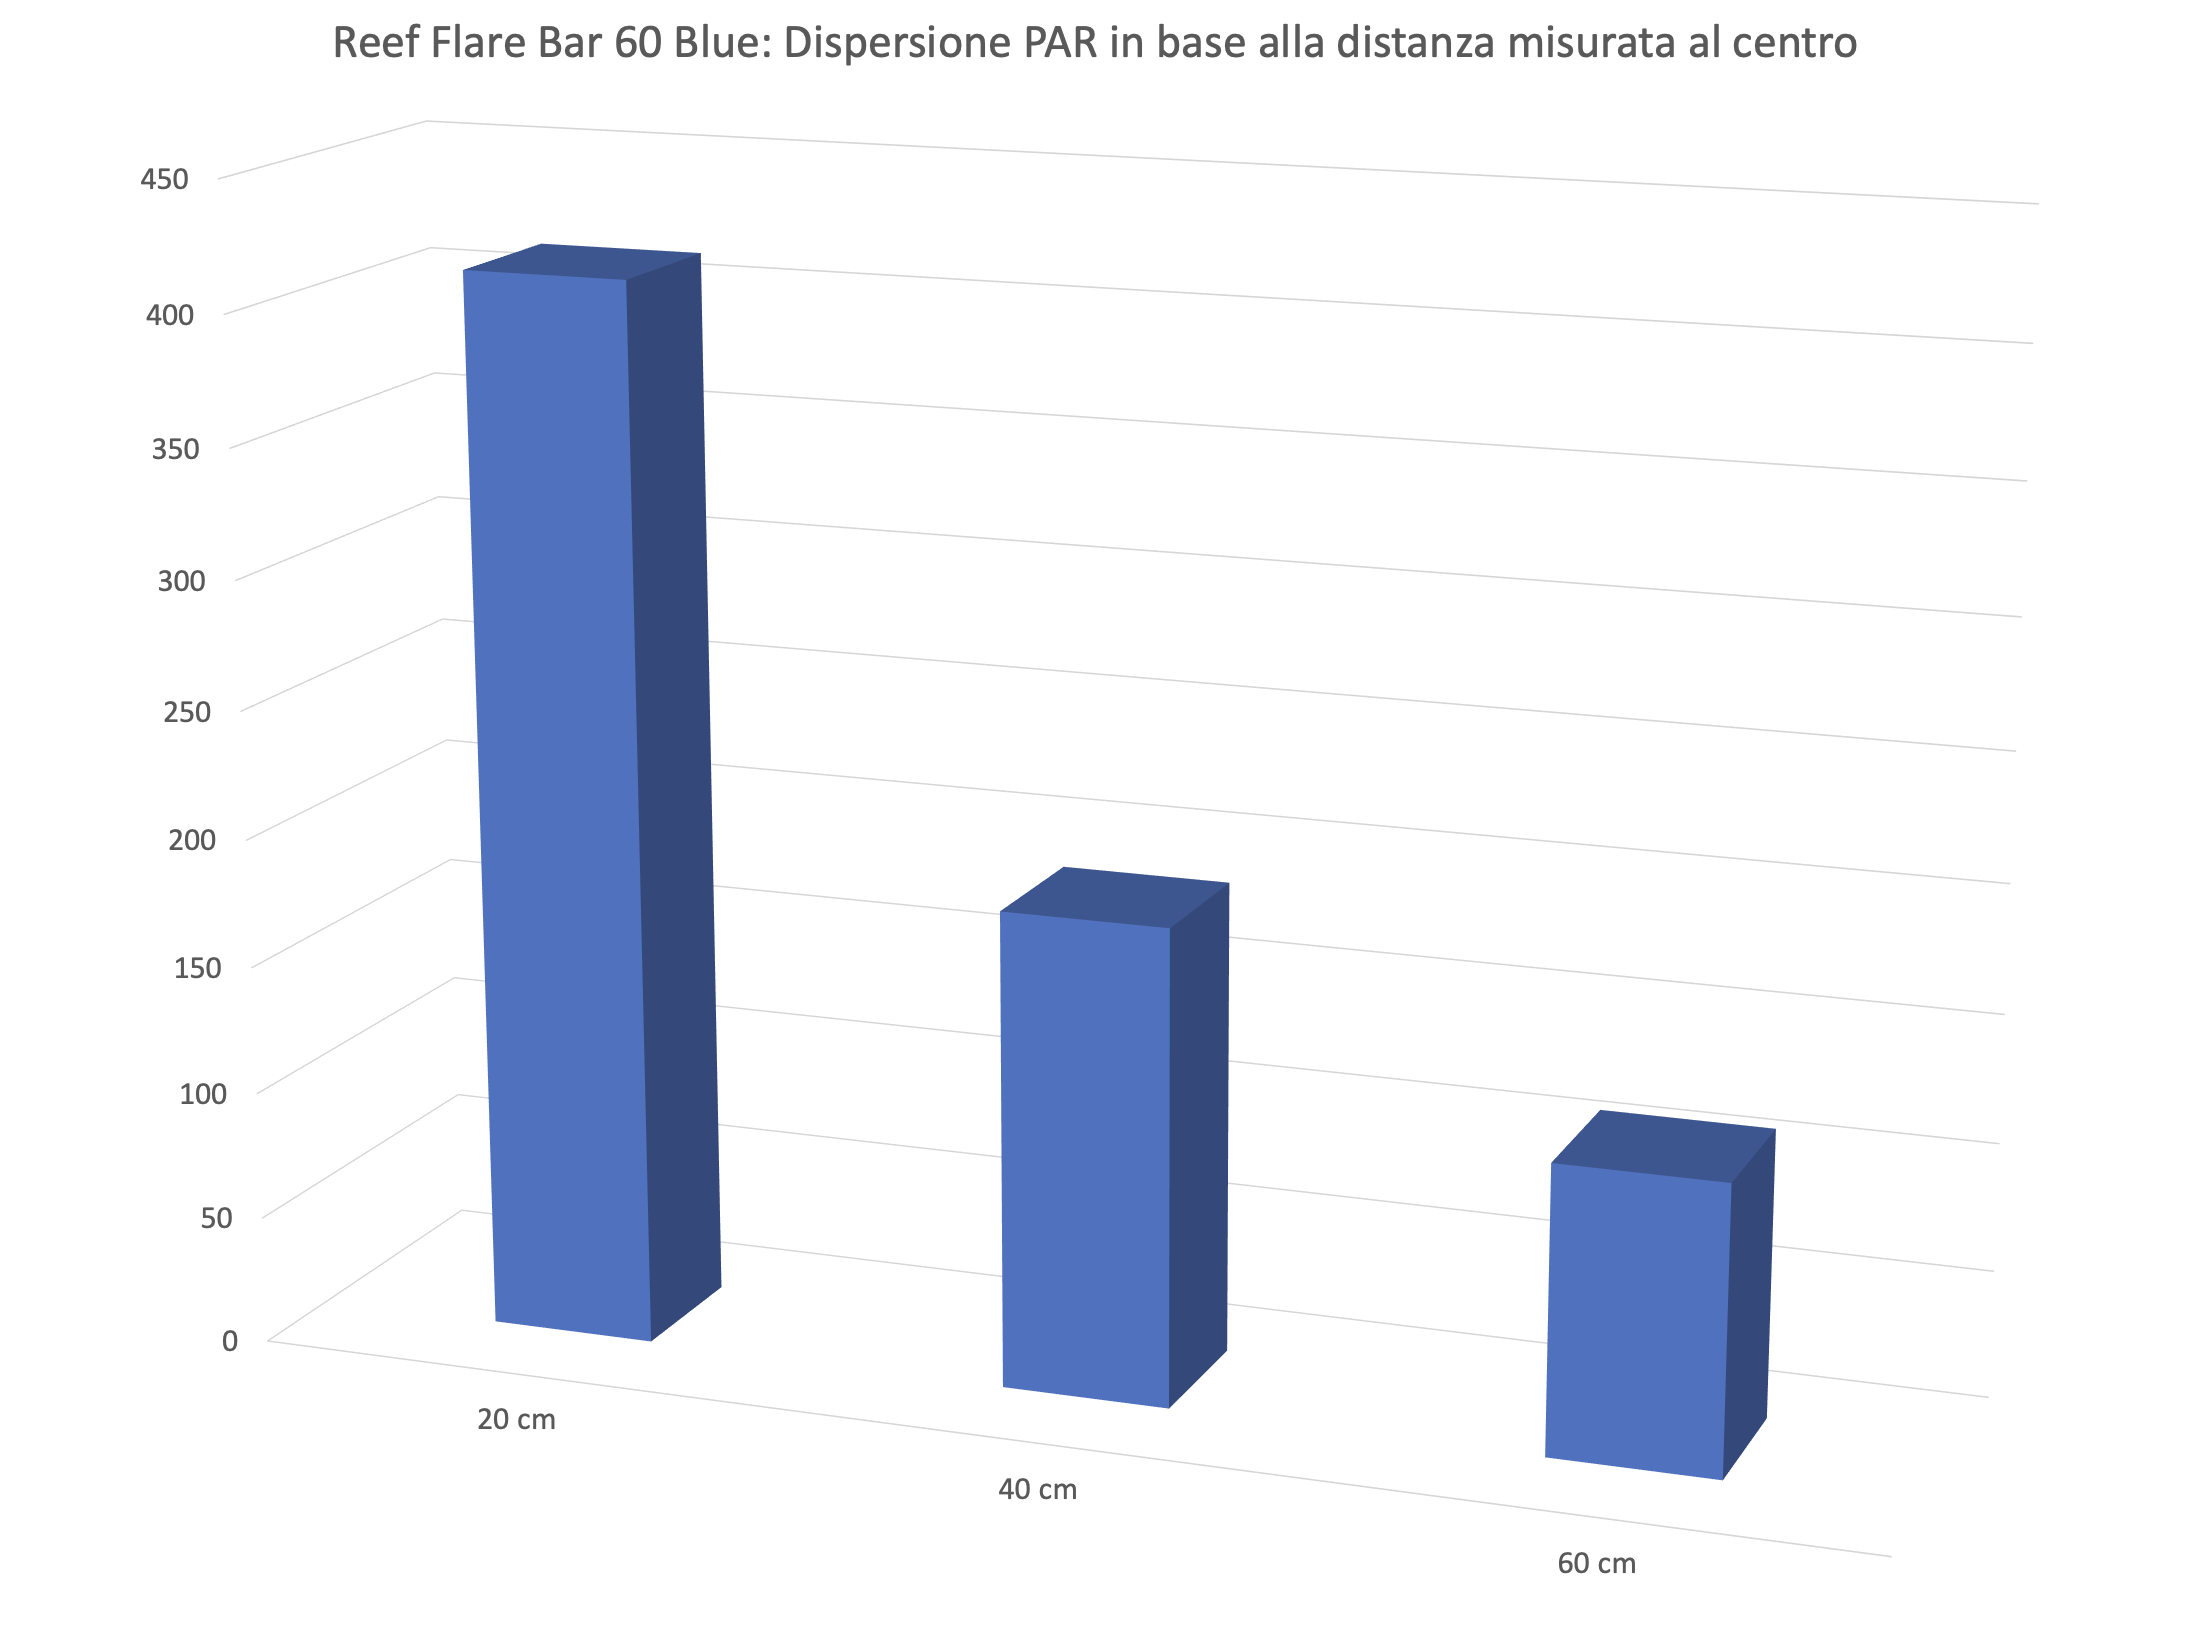
The PAR in the middle in the different configurations
Let’s continue with our technical measurements. We can see how, in a chart, the PAR collected in the middle decrease in the three different distances of our tests.
Energy variation of the Reef Flare Pro L Blue depending on the distances
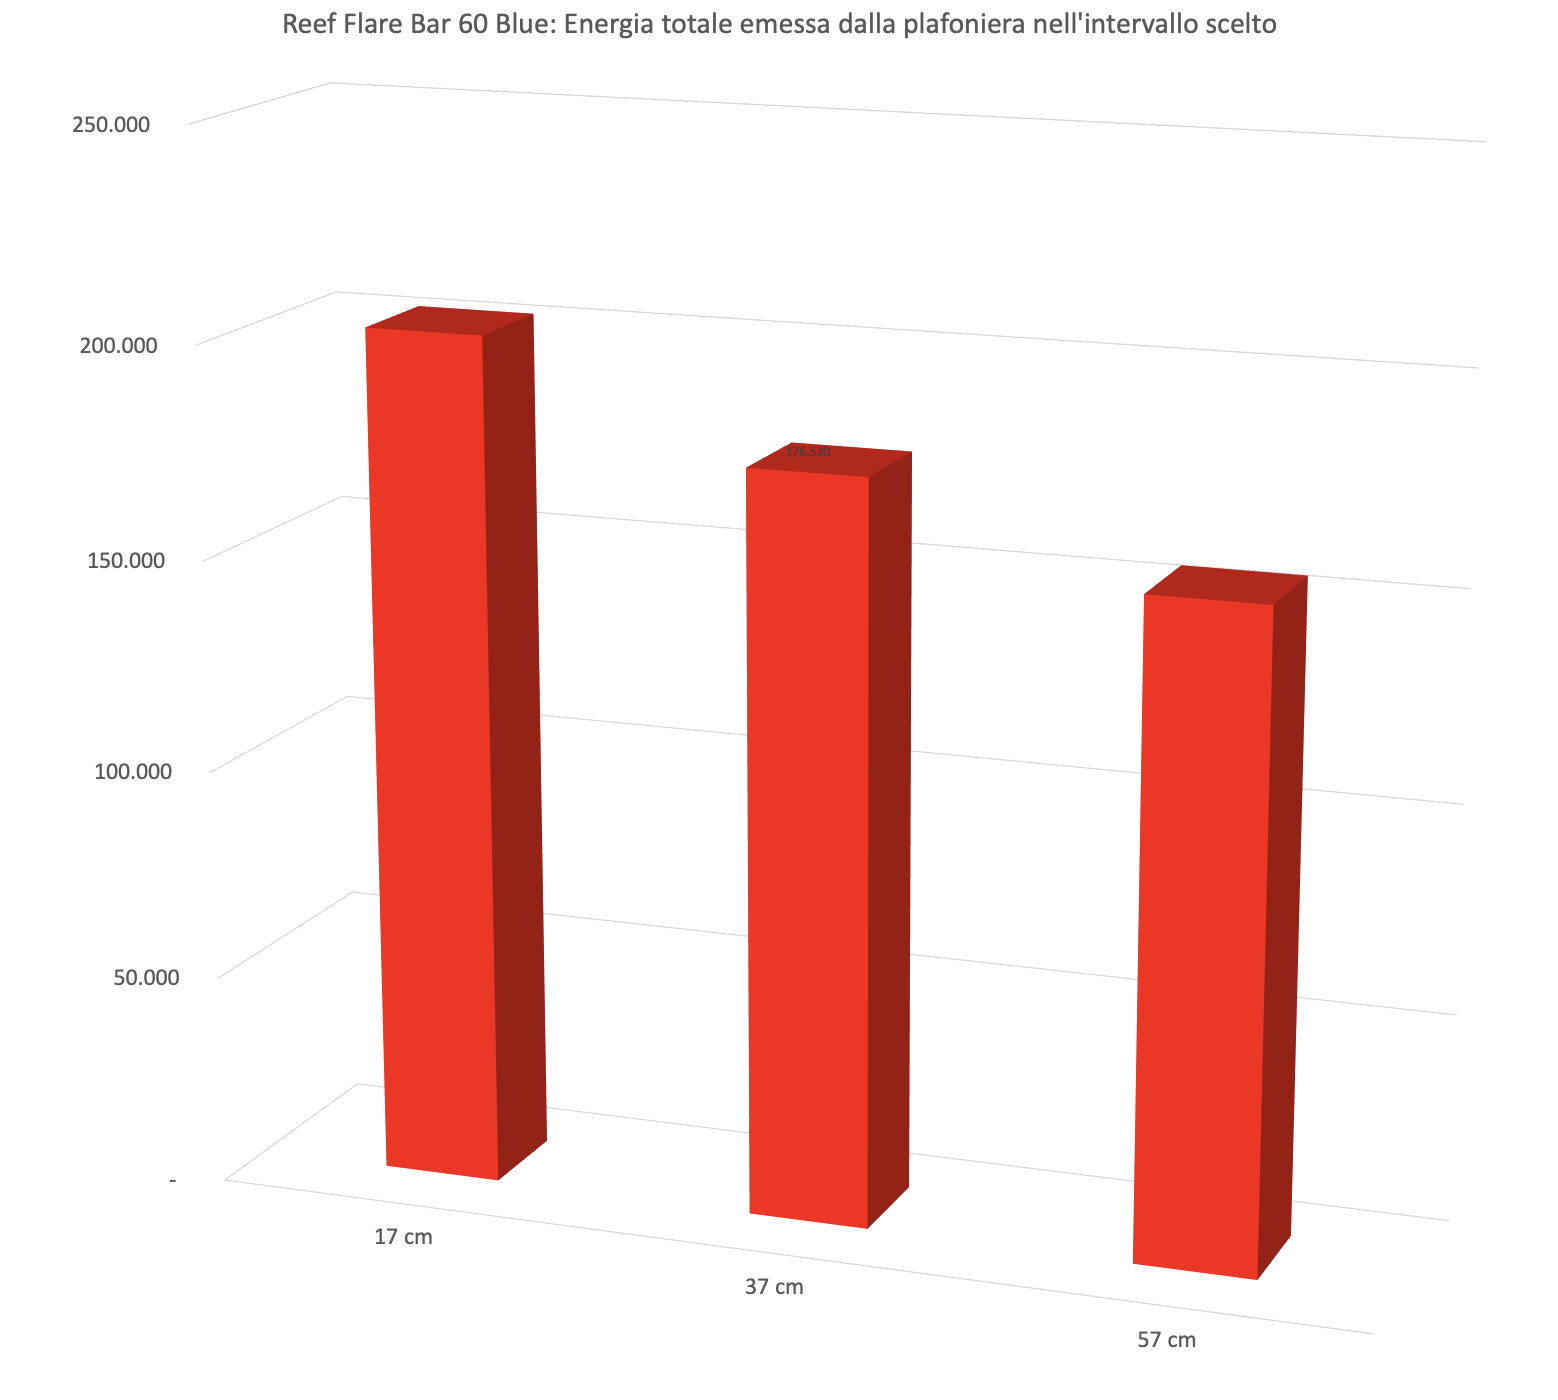
his is the most significant and most comparable data: the energy variation. We calculated the volumes of the three surfaces previously seen. It’s obvious that moving away from the ceiling light the PAR decrease, also because the light illuminates a wider space. In this way you can consider all the light energy contained in the 60×60 cm area subtended by the ceiling light. And the three values of 202.000, 177.000 and 155.000 assume a different connotation compared to the values in the middle. When the first ones decrease because of the increasing of the distances, the subtended area, that is the energy, decreases slowly. Little energy spreads outside the subtended area.
And after looking at the values of the three curves in the charts you can see that on the sides there’s much more light at 57 cm than at 37 cm.
Also, the chart shows an almost perfect uniformity in the various distances. This means that in a 60 cm aquarium the light that spreads out of the tank is very minimal.
Let’s continue on page three with the costs, the comparison with other ceiling lights on the market and our final comment.


