

Our new method DaniReef LAB for PAR measurement of the Philips CoralCare
Antefact: (this paragraph is the same for each ceiling light measured with our DaniReef Lab for explaining the working method) During the long nights spent on our forum we always wondered how could we compare PAR from different ceiling lights. Even though we had the perfect device, the Quantum Meter MQ-510 di Apogee, we always referred only to the value measured at the centre at 20 cm of distance, more or less.
The Quantum Meter MQ-510 measures the PAR, expressed in PFFD that is photosynthetic photon flux density in μmol m-2 s-1. This device is calibrated to work underwater, so if it’s in air the measured value has to be divided by 1,32 that’s the dive factor. We have to do the conversion. The values you’re going to see are correct.

We decided to make a square base of 70×70 cm, we set 17 fiducial points where we placed the sensor Quantum Meter MQ-510 and we also made 3 lifts of 20, 40 and 60 cm for the ceiling light, in order to have the same distance from the sensor. This will allow us to create the curves which can be compared to other ceiling lights’s, all tested at the same distances. Notice that this distance is measured between the base of the sensor and the ceiling light. In reality it should be decreased of 3,5 cm that is the height of the measurement cylinder and increased by 0,5 cm that’s the dimension of the spacers that lift the ceiling light.
In total the three measurements are made from 17, 37 and 57 cm of distance. Because they’ve been done in air they will be corrected.
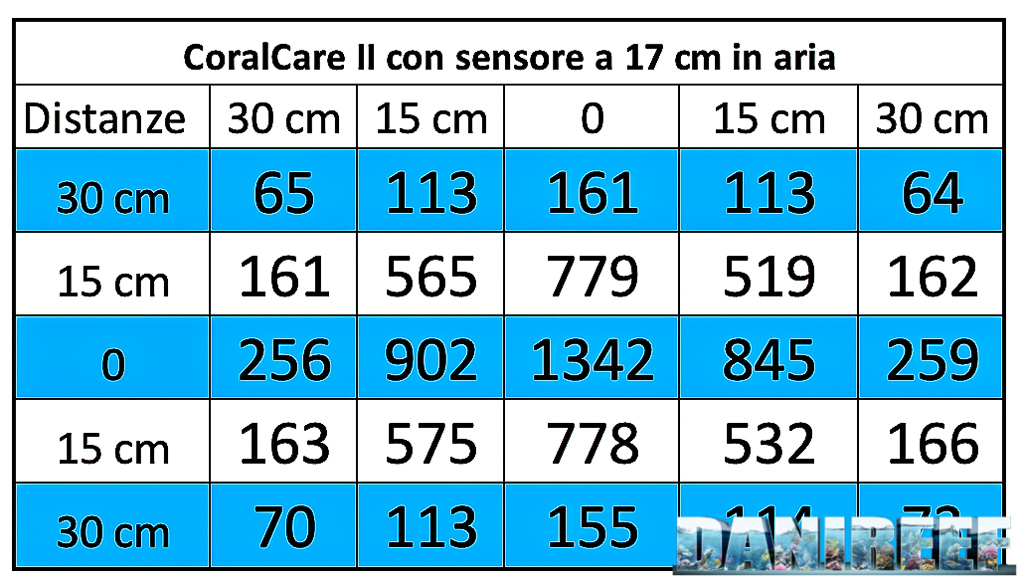
PAR measurement from 17 cm of distance
The ceiling light has been placed at 17 cm of the display. The points not indicated on the panel have been estimated in the following chart.
Here the collected values:
And this is the corresponding chart, we came back to the classic scale in orther to compare similar ceiling lights.
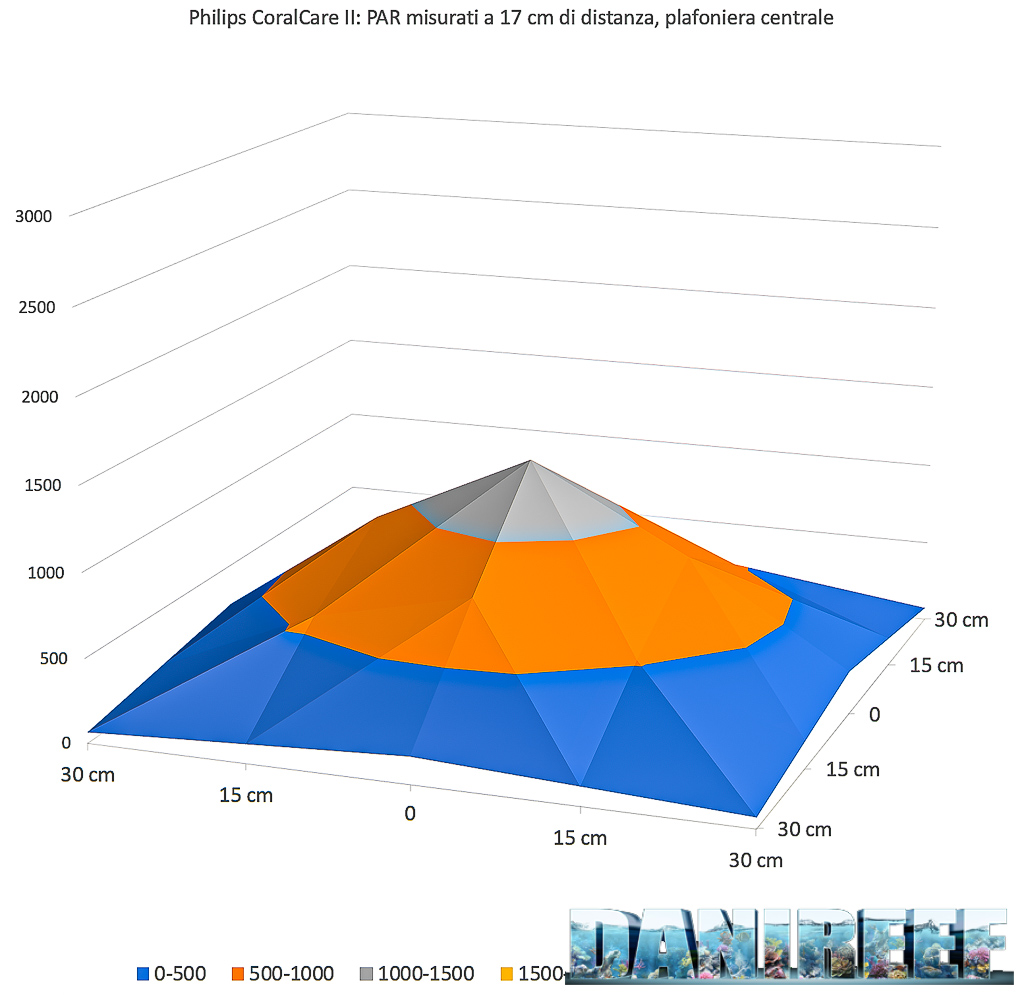
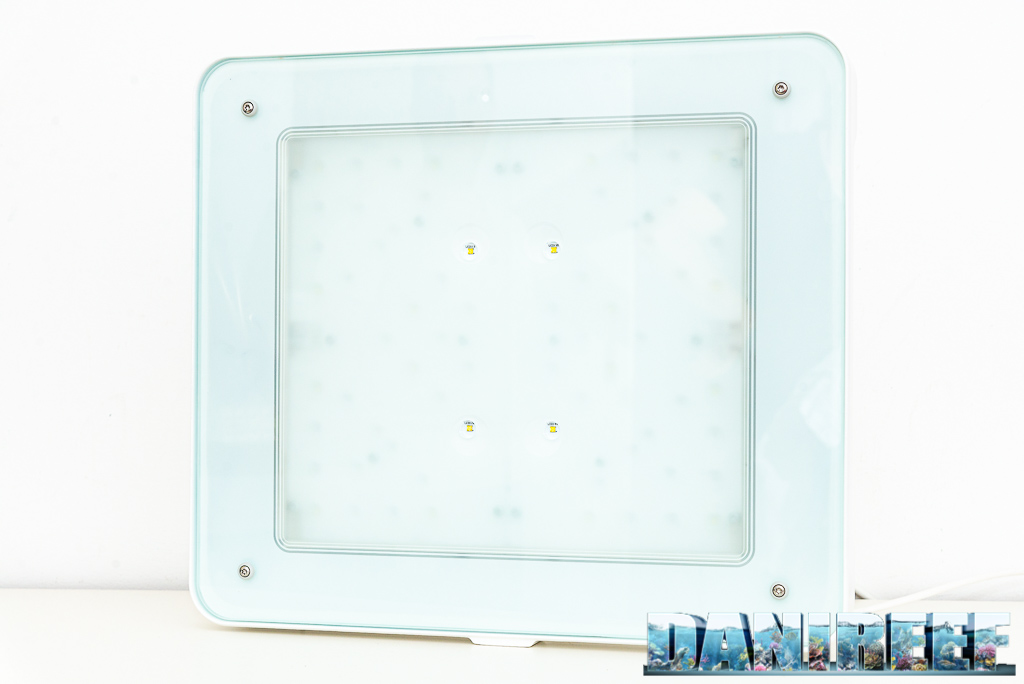
The first measure considers a small distance between the ceiling light and the sensor. For this ceiling light we can see that the difference in the middle and on the sides is very low. Small peack power, but great covering. In line with what we could imagine from the desing of the ceiling light. Rememeber that the ceiling light measures 46×41 cm while our area is 60×60 cm.
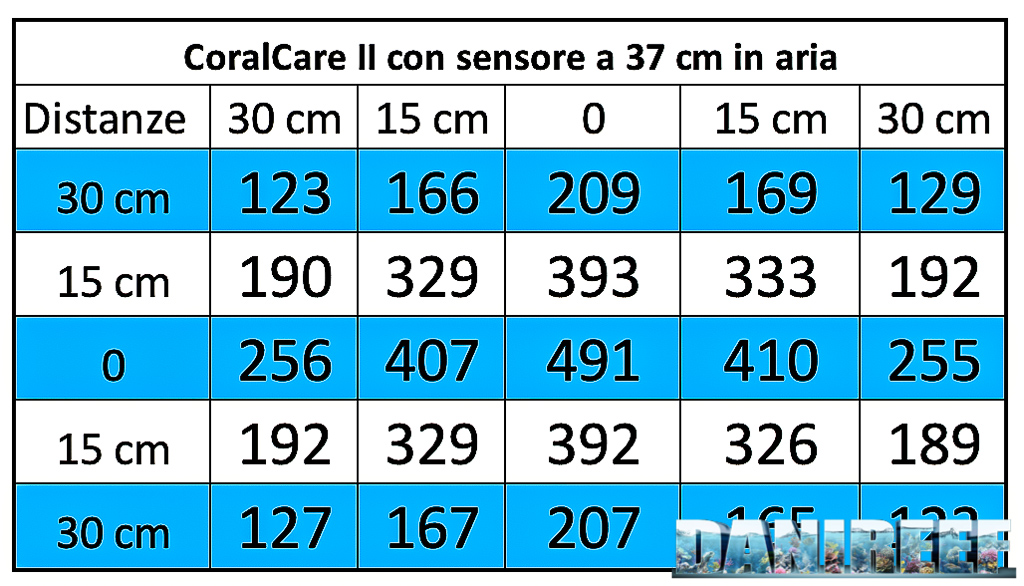
PAR measurement from 37 cm of distance
In this step we adopted a distance of 37 cm.
Here the collected values:
And the corresponding chart:
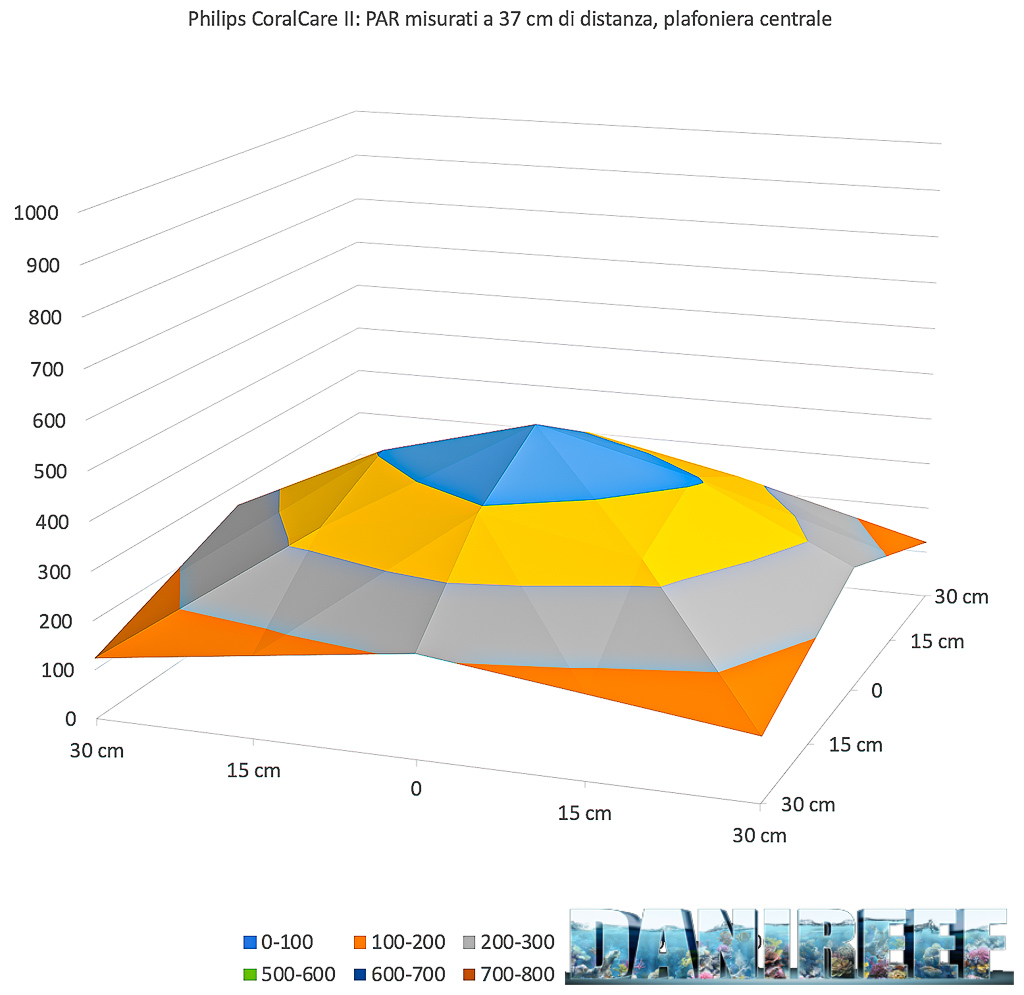
Increasing the space between sensor and ceiling light the curve is even more complete. The value in the middle decreases from 1342 to 491 μmol m-2 s-1.
PAR measurement from 57 cm of distance
At the end we adopted the distance of 57 cm.
Here the collected values:
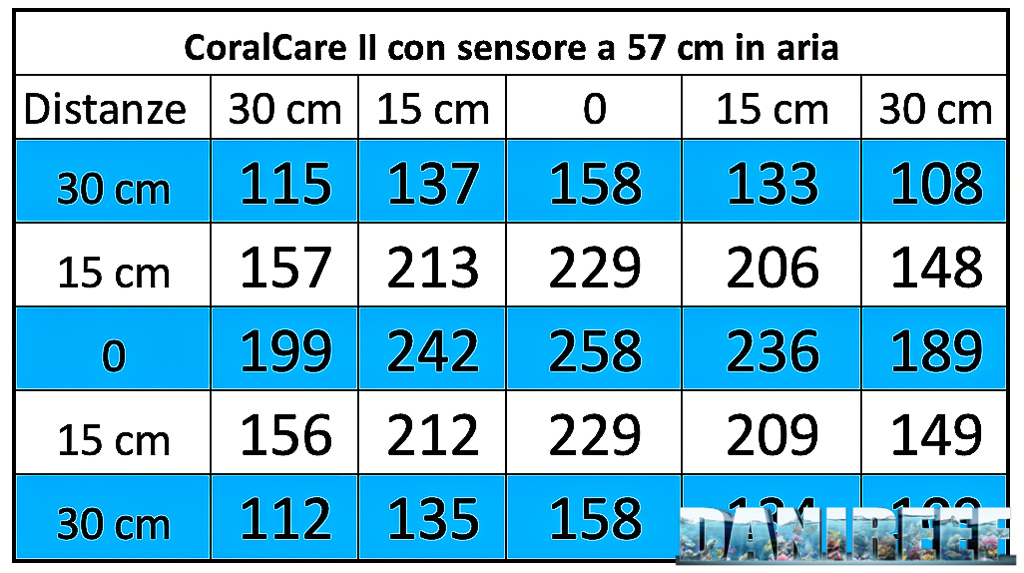
And the corresponding chart:

With a bigger space between ceiling lights and sensor, it decreases the difference between PAR in the middle and on the sides. The curve is almost flat. We have a higher uniformity but less power in total. The light spreads, but the central value decreases from 1342 to 491 to 258 μmol m-2 s-1.
It stands out that the covering is completely uniform.
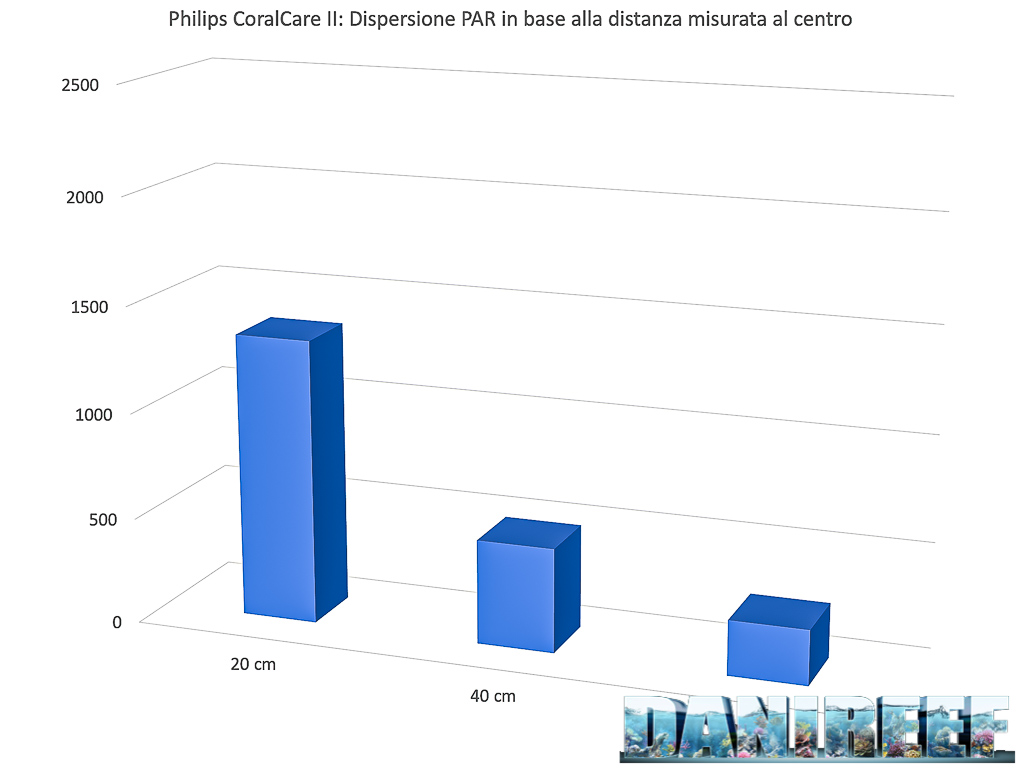
The PAR in the middle in the different configurations
Let’s continue with our technical measurements. We can see how, in a chart, the PAR collected in the middle decrease in the three different distances of the tests.
Energy variation of the LED bars Philips CoralCare Gen2 depending on the distances

This is the most significant and most comparable data. The energy variation. We calculated the volumes of the three surfaces previously seen. It’s obvious that moving away from the ceiling light the PAR decrease, also because the light illuminates a wider space. We try to consider all the light energy in this square of 60 cm under the bar. And it’s visible that the three values of 1.333.430, 920.227 and 631.087 assume a different connotation compareed to the values in the middle. When the first ones are low because the distance is high, the subtended area, that is the energy, decreases less, because the “main part” of the lighting is in the middle. This is the theory.
Looking at the values of the three curves it’s noticeable that on the sides there’s more light at 37 cm than at 57 cm or at 17 cm, which is, obviously, the distance with less power on the sides.
Value in the middle for each channel at three distances
We also measured the value in the middle of each channel in order to give you an idea of the contribute of each channel to the PAR.
Here the collected values:
| Distance = 17 cm | Distance = 37 cm | Distance = 57 cm | |
| Channel 1 Blue | 605 μmol m-2 s-1 | 220 μmol m-2 s-1 | 116 μmol m-2 s-1 |
| Channel 2 Warm | 741 μmol m-2 s-1 | 275 μmol m-2 s-1 | 146 μmol m-2 s-1 |
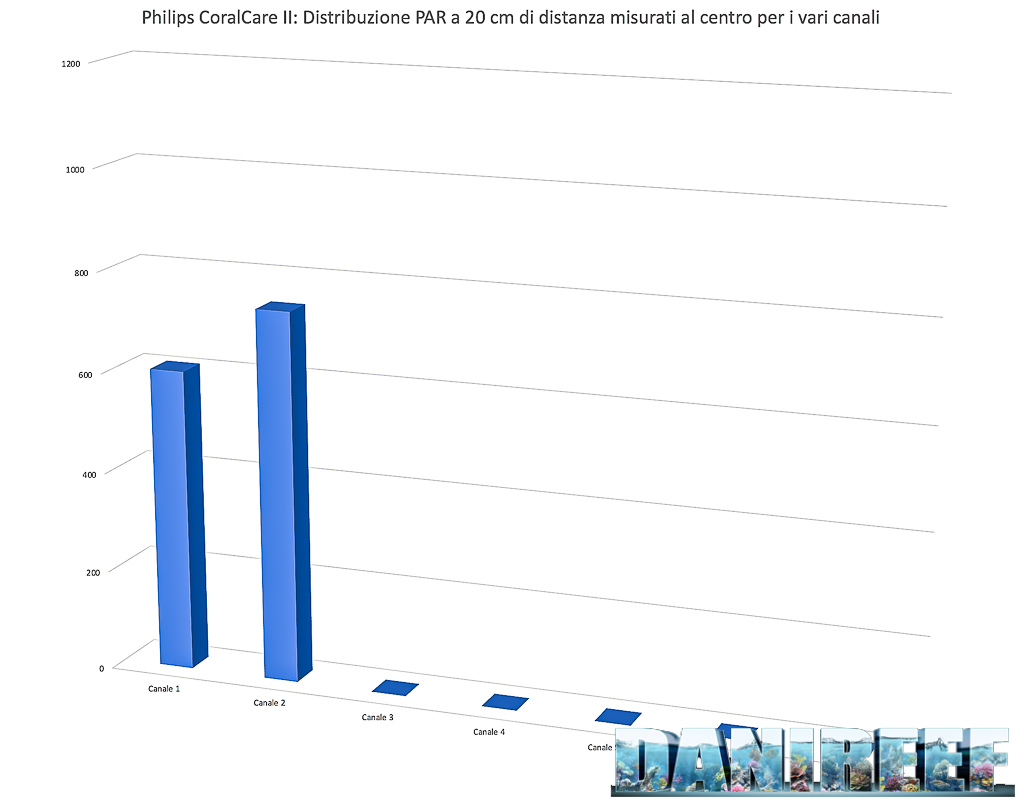
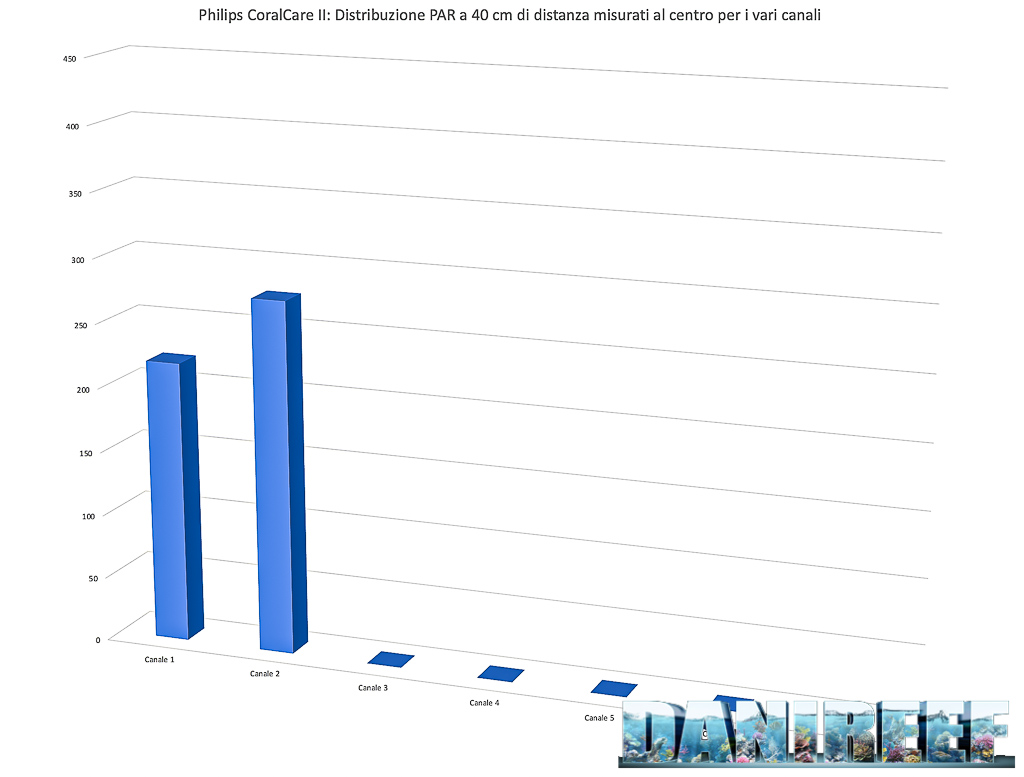
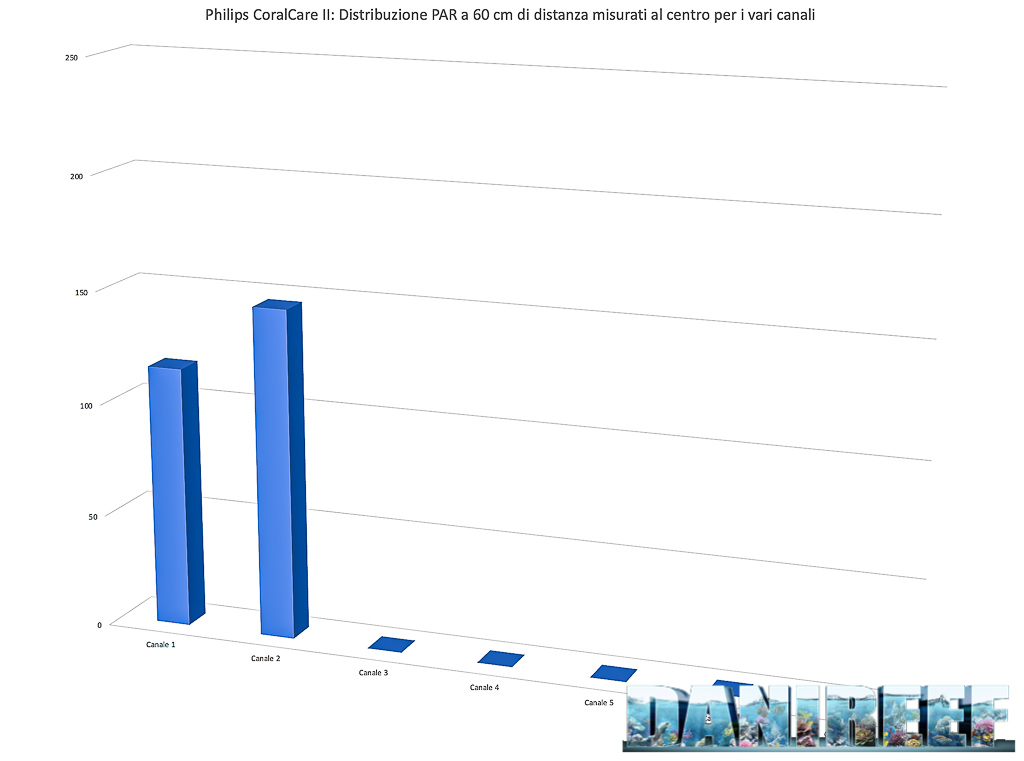
The two channels are almost equivalent, with a slight predomination of the warm one.
Consumption
The measurement of the consumption was made possible thanks to the useful device RCE PM600 that can also measure the Cos(fi) (or power factor). The result is already given in watt.

Here above there’s the maximum power and below the Cos(fi).

The Philips CoralCare Gen2 ceiling light consumes 168 watt. Considering that at 17 cm the ceiling light has 1342 μmol m-2 s-1 in the middle, we can say, in perspective, that it has a peak value of 7,99 μmol m-2 s-1 w-1 (PAR per watt).
The power consumption is practically the one declared on the technical data of the ceiling light. 168,5 watt against 170. The loss is under the 1%.
Philips CoralCare and the heat
Philips says that if the ceiling light is maintained in an environment of 35 degrees the LED will last until 25.000 hours before having a decay of 10%. 35 degrees with the channel at 100% will bring the temperature of the shell to 68 degrees, more or less. In case you exceed a temperature threshold, we don’t know the value, a system enters in action and it automatically switches off the ceiling light. There aren’t any dimmerations and it never happened to me.
Let’s continue on page three with the cost, the comparison with other ceiling lights and our comment.


